|
File Menu |
Open favoritesOpens the box of the collections of typical maps (topographic, orthophotos, ground cover, protected areas, etc) that conform favorite collections and facilitates to the user the location in the map by place-name or by coordinates from the first moment. The new button A few seconds after opening the favorite collections box, in the program logo area, information is provided from MiraMon's Twitter, the latest news from the Version Diary and the MiraMon User Forum (FUM). This option is by default, but it can be modified through the PaginaHTM_AlternativaPresentacio= key in MiraMon.par, in order to indicate an alternative HTML page to these pages and typically display corporate information (latest news on an administration's intranet, instructions for students in a classroom, etc). With the "Configure" button at the bottom of the box, it is possible to add, modify and delete the directories where the favorite collections are located with the buttons 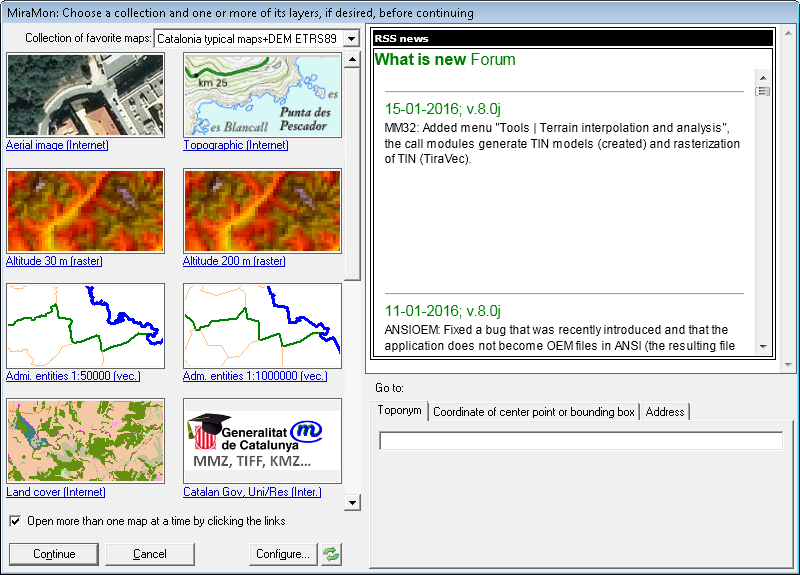
Open recentAllows to open any type of open, used or recently created file, both from the main module (MM32) and from any other (MSA, etc), using the "Open recent layer" button It also allows to delete from the list, using the button 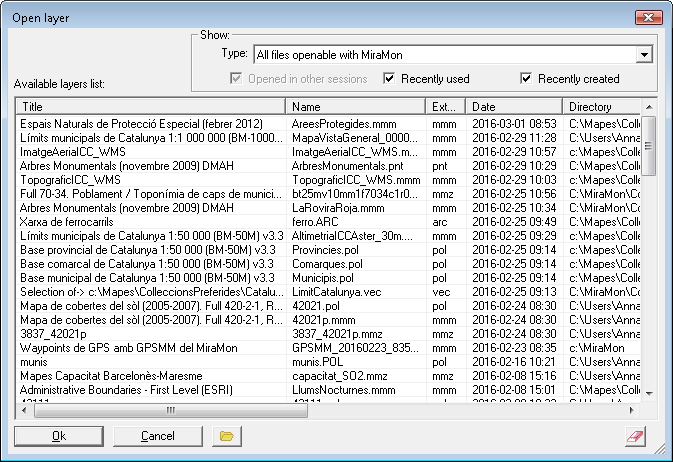
OpenIt allows to open any element that the program is able to open without importing: maps, compressed maps, raster layers, vector (including GPX, KML, etc), MLC layer catalogs leading to WMS, REL (which are open with GeM+ if they are layer, serial or multiserie metadata, they are open with MM32 as point layers if applicable, or with the notepat if they are REL distributed), DBF (which are open with MiraDades), old palettes (P25, etc, which are open with the notepat), old metadata files (DVA, DOC, etc, which are open with GeM+), etc. The button 
Open mapMiraMon Maps are text files, with MMM extension, describing sets of raster and/or vector files, arranged in a given way, i.e., heaped in a certain order, and with specific viewing characteristics (color, scale, etc), printing characteristics, etc. MMM files (MiraMon Maps) define the graphic files to use and how to show them, although they never contain data, but simple references to it (name, path, etc), so saving disk space and increasing data consistency. Prior to loading a Map, MiraMon shows what types of information it contains in order you indicate which do you wish (for example, you can open a Map only to get the cartographic layers, but you do not want the title, sheet boxes, etc, or, vice versa, you only wish the sheet boxes). Among the available sections on a Map we draw attention to the title, the cartographic layers, the reference frame for printing, the sheet boxes, etc. For more information, consult MiraMon map and template format description. 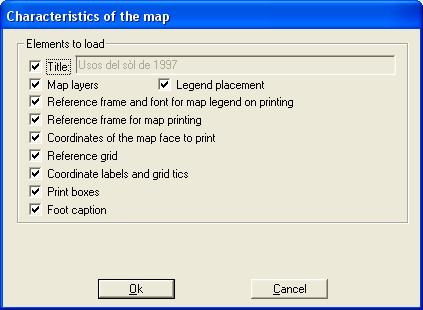 When you open a MiraMon Map you are never asked about colors, palettes, etc, because all this information is contained in the MMM file. Of course you can modify the viewing characteristics a posteriori.
Open rasterThis allows opening raster files (satellite images, aerial photographs, MDE, raster thematic maps, etc.) in binary IMG format (*.img), JPEG (*.jpg), complete JPEG2000 (*.jp2) or without header (*.j2c), MrSID (*.sid), etc., which must necessarily have an associated metadata file, with extension *I.rel, in the case of IMG. In the other raster formats for which direct opening is supported, the presence of the metadata file is optional although, naturally, it allows the information to be available with a greater wealth of associated information; The metadata file extensions for rasters that MiraMon is able to open are: *J.rel in the case of JPEG, *2.rel in the case of full JPEG2000, *C.rel in the case of JPEG2000 without header, *S.rel in the case of MrSID, *T.rel in the case of TIFF, *B.rel in the case of BMP, etc. Other formats can be opened directly although, for the moment, they do not have metadata files, such as ECW, DIB or RLE. Finally, some raster formats require to be imported to be viewed with MiraMon, such as the CEOS format, ASCII formats, etc. (see "File | Import" for a complete list of them all). For compatibility with the formats that are supported by MiraMon before version 4.0, the IMG files can have an associated *.doc file instead of a *I.rel file, even though this situation is not so advisable because DOC files are a lot poorer in metadata and they can't have automatic symbolization or links with a related database. Accepted sub-formats for IMG files are bit, byte, byte-RLE, integer, integer-RLE, long, long-RLE, real and real-RLE, which are described in MiraMon raster format description. The double and double-RLB subformats, although supported, are used internally for high-precision calculations and are rarely stored as regular-use layers. It is also possible to read BMP (Windows BitMaP), RLE (Run Length Encode) and DIB (Device Independent Bitmap) files, either compressed or uncompressed files and made from Windows or OS/2 platforms. Of these formats, files of 1, 8 and 24 bits by píxel are supported. However, in formats that are different from the ones from MiraMon (IMG, JPEG, JPEG2000, MrSID, etc) there will just be a simple display and some of the analysis functions are not available. Since 2014, all MSAs have gradually been made to support multiple raster formats, with fewer and fewer MSAs requiring import. Translating these formats to IMG allows, for example, use these files in any of the MSAs that work with raster formats. It is possible to do this by saving the raster file as IMG by using the option "File |Save raster/WMS or WMTS as raster", or as JPEG by "File | Import | JPEG -> IMG/BMP". As of May 6, 2008, the B.rel format is fully supported as a BMP metadata file, allowing BMPs to incorporate complete metadata and, of course, full georeferencing; this capability is especially interesting because if an uncompressed 24-bit format (original quality) is desired for viewing, the internal BMP format is which allows the fastest viewing on Windows operating systems. For other raster formats, consult consutad Import options. In order to open a raster, first the file that contains it must be selected and or drag it from the explorer (drag&drop) and then choose the color symbolization table, also called palette (see Reading files directory), unless this is already indicated in the REL file (which can be achieved from the Save button in the layer display options). The color assignment in MiraMon raster files is done based on a color symbolization table, where each color is associated with a category and has its own meaning isolated from the rest of the categories (in the case of thematic rasters) or is associated with a light intensity captured at a certain frequency (in the case of satellite images or aerial photographs), etc. RGB compositions and JPEG, JPEG2000, MrSID, BMP, RLE, DIB files are opened directly without the need for any palette. MiraMon includes some palettes for cases in which a palette is required and this is not supplied with the raster; palettes are provided for continuous variables (gray level palettes, digital elevation models, etc.) and for categorical variables, in both cases in various formats (DBF, P25, PAL, etc.). For more information on the palette format, see Symbolization in MiraMon. If Esc is pressed or the color symbolization table selection is canceled, a grayscale palette will be used, which for bit files (B/W or 1 bit/pixel images) consists of 0=black and 1=white and for the rest of the files it will be a 256 grayscale, unless the raster is associated with a category table, in which case, a palette of varied colors will be used. The initial display is carried out following the geometric criteria explained in "Zoom | Zoom management mode". When you are inside the client area the cursor is a special cross, which is visible on any color and that allows you to see the color of the pixel consulted through a small central window the size of one pixel, or through a cross with a bigger window. For more information about cursors and how to move in a raster file, consult MiraMon general visualization characteristics. When closing a raster, if you have made modifications in the color symbolization table, MiraMon will offer the possibility to keep the new symbolization table, in order to use it next time you open this raster. On the other hand, whenever you store a MiraMon Map composition (file *.MMM), the present visualization characteristics are like the automatic characteristics independent from those specified in the REL file. For more information, consult Appendix MiraMon raster format description and MiraMon map and template format description. For 24-bit RGB displays composed of 3 different raster files, see Open RGB -> 24 bits.... Similarly, for reductions to 256 colors (8 bits) of RGB compositions, see Open RGB -> 8 bits... Once the raster is visualized you can query its value in any point of it by simply clicking on it with the left mouse button. However, the raster query cursor ( The result of a raster query firstly informs you about generic data of the consulted base, as for example:
If you press the button 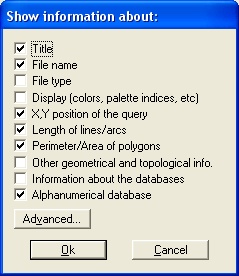 In a location query, when there are several connected tables, the connection will be broken due to the presence of a NODATA value in a field which is implied in the chain of relations. By pressing the The second information block provided in a raster location query is concrete information about the consulted point. All the readings take place in the original data file, independently of the color scale we are using. In addition, the queries box can contain enriched text, thus:
Therefore, if your databases contain fields with filenames, you can select these names with the mouse (either dragging and marking or double clicking) and, through the connection button with other programs, open them in the corresponding applications. For example, you can have text names in plain format, text names with a format for any processor, names of databases, spreadsheets, photographs, scanned planes, etc, and you can even open other MiraMon Maps. These connections work for any connection that you have established through the association of extensions and programs that the Windows explorer offers. If an extension is not recognized, you can make it be recognized through these programs. The files can be connected with Windows applications and DOS applications. By using both buttons in the bottom right corner of the box of query results ( Location query in thematic raster: In thematic rasters, associated with an alphanumeric table that acts as a category dictionary, two fields are shown: a numeric field which acts as an index of the category (and that has a value that agrees with the value found in the raster cell) and the text field that contains the description of the category. From the MiraMon Universal Geospatial Metadata Manager it is possible to indicate, if necessary, that the first of these fields will not be visible. 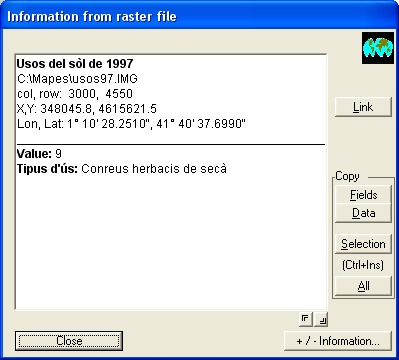 Location query in multiband rasters: In queries about multiband rasters we can visualize a single raster or a RGB band combination of one or various images (remote sensing images, multiband rasters, etc). In any of these cases, when a query is made the resulting values in all of the bands are shown as different fields (except if some of them have been made non-consultable by the Universal Geospatial Metadata Manager). The name of the field corresponds to the description indicated in the metadata or, if it is empty, the name of the file; with JPEG, JPEG2000 and MrSID color files without descriptions are given the names R, G and B. In addition, to make it clear what is the value in the band or bands that are being visualized, you can follow the guidelines below:
The units that appear in brackets in the raster queries come from entering "units=" of REL file of images (I.rel, J.rel, etc), editable from the thematic information section of the GeM+. The property of multiband rasters is not only applicable to remote sensing cases, but also to other cases, such as the following examples: Example 1: We can have a multiband raster as a Digital Terrain Model (DTM) made up of a Digital Elevation Model, a Digital Slope Model, a Digital Solar Radiation Model, etc. We can also have in the same multiband, 3 bands in a single file in JPEG format that represent a shaded hypsometric view to see the relief better. We can make the 3 bands of the JPEG file non-consultable (because their values are irrelevant from an informative point of view: they are simply intensities of color) except in order to visualize the DTM through the JPEG file. Therefore we have a very attractive chromatic visualization and when we query a point of the land we obtain the elevation, the slope, the solar radiation, etc, in different information fields. Example 2: We can have a multiband raster that contains different land use maps obtained by classifying remote sensing images made at different times (for example 1987, 1992, 1997 and 2002). We establish the visualization through the most recent map but when making a query we obtain the land use of that point in the 4 years. A variant of this example is to use a view in JPEG format obtained with a shaded DEM of the most recent map for the visualization. 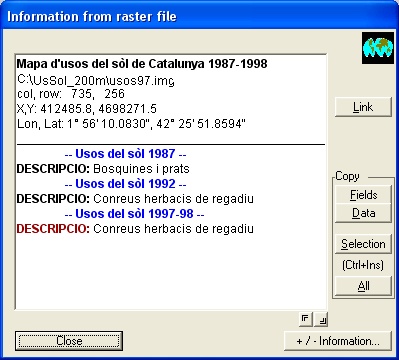
Example 3: We can have a multiband raster that contains the rasterization of a conventional topographic digital sheet (or the scanned and geo-referenced sheet published on paper), which is not for analytical queries but simply for visualization, and have other additional information bands that seem to be of interest, as for example in the country and state, if there is a protected area in that point, etc. In order to end the query, press the button "Close". For more information about RGB rasters, consult the corresponding section in Open RGB -> 24 bits. This allows you to open three byte, integer, real, etc images, and they are turned into 3 images of 8-bit or 256 grey levels/pixel for each one. Every image is associated with a color gun of the R (red), G (green) and B (blue) monitor. The preformed image is a 24(8x3) bit/pixel. These images can hold up to 16.8 million colors, much more than what the human eye can see. For this reason the color quality we get is like the natural one. The RGB combinations can be made with rasters of any format described in MiraMon raster format description. It is also possible to open different formats for each component of the combination (for example if the R component is a byte-RLE image, the G component is a real image and the B component is an integer-RLE image). When the RGB files correspond to the three channels that collect the red, green, and blue colors of a sensor (and in that order), the image has the same chromatic appearance as it can be seen with human eyes and it is said real color image. In any other case, the colors that can be seen in the image do not match to those seen with human eyes as "real" and that is called a false color image. Remember that JPEG, 24-bit BMP, etc, files are read directly through the "Open Raster" option in the File Menu. This option is also accessible from the menu or with the Alt + Location query in RGB rasters: Once a RGB combination is visualized, the value of any point can be consulted simply by clicking with the left mouse button. The structure of the information is similar to the Raster query. However, the content of the information is different, as is shown below. In a query about a raster which is visualized in the RGB way the information given is the contents of the pixel in all the bands, not only in the 3 selected for the visualization. This implies that if we make a RGB combination of 3 bands pertaining to 3 different multiband images we will obtain in the location query, information about all the bands in the multiband files to which the bands used in the visualization belong to. Additionally, when presenting/displaying the information, the data of the bands used for RGB visualization are in red (R), green (G) and blue (B) respectively. The other aspects of the raster query can be consulted in Raster query. 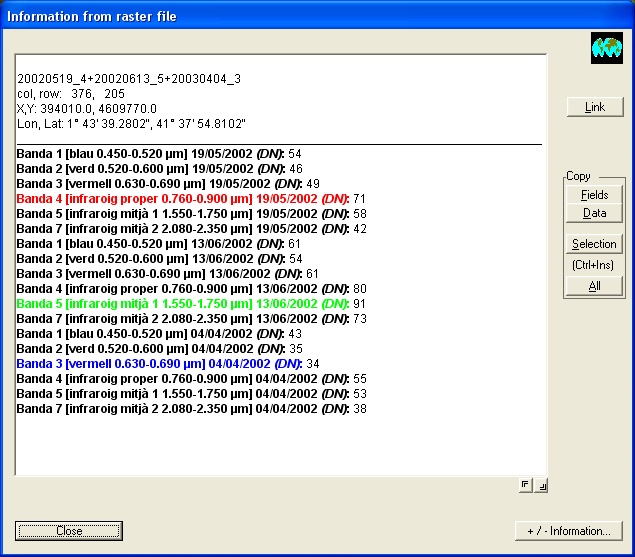
This allows you to open three byte, integer, etc images, and they are turned into 3 images of 8 bits or 256 grey level/pixel, every image shows color gun of the R (red), G (green) and B (blue) monitor. Nevertheless, the performed image is not a 24 (8x3) bit/pixel (16.8 millions color) but rather a reduced and optimized palette and an image for 256 color systems (8 final bits/pixel) is computed. RGB combinations can take place with rasters of any of the formats described in MiraMon raster format description and it is even possible to open different formats for each component of the combination (for example the R component is an image byte-RLE, the G component is real and the B is integer-RLE). Before starting the computations, MiraMon makes it possible to visualize the composition by using an optimized color symbolization table (made by MiraMon), or to use a preexistent one (made by the user previously or any of the MiraMon color symbolization tables). Independently of the color symbolization table used, MiraMon makes it possible to make a linear expansion of the 3 RGB components. MiraMon activates this option of "Expansion of contrast" but if you have optimized images or scanned rasters you should not activate this option because you will obtain colors that are too contrasted. For more information, consult MiraMon symbolization tables description. 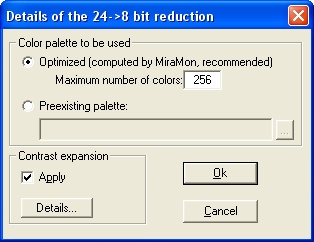 If you press the button "Details..." you will access the box of Image enhancement from which you can indicate a percentage of independent saturation for each end of the histogram (lower and upper). This option usually produces a better quality final visualization, although some zones with very high or very low reflectance can be burned or blackened. MiraMon offers the possibility of saturating the histogram tail (lower and upper) by 1.5%. 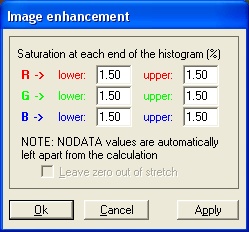 In order to define which saturation percentage for each of the tails produces a better visualization, you can repeat the process (Open to RGB - > 8 bits) as many times as necessary, modifying the percentage, or you can make the histogram of each image. As this process is based on a color distribution study of each RGB loaded composite, the color quality we can get is quite acceptable, although not as good as the quality obtained when a 65536 color system (or 16.8 millions) and the "Open RGB-> 24-bit" option is used. Users of systems with 65536 or 16.8 million colors will just use the RGB-> 8-bit reduction when they need to save RAM (24-bit images fill triple amount of memory). On the other hand, they must wait for the time to process the new 8-bit file and its associated palette. Moreover, it results in a worse display. When RGB files belong to the three bands which receive the red, green and blue colors (in that order), the image has the same chromatic view (or very similar) that we see with our eyes. This is called a real color image. In any other case, the colors we see on the screen do not match the colors we see with our eyes as "real" and this is called a false color image (or false color). As the color optimization process and the new 8-bit image formation is quite slow, when you leave the image (by opening another one, closing the current one or leaving the program) MiraMon will give you the chance to save it (as an *.IMG image with its documentation file *.REL) as well as save the color symbolization table (DBF, PAL, etc). Therefore, next time you can open the composition using the saved color symbolization table. You can also use the color symbolization table as a preexistent table if you open the RGB-> 8 bit composition again, and thus you will avoid some of the computations. Remember you have to read 24-bit BMP, JPEG files directly from the Open raster option, in the File Menu. For query RGB->8 bit, the operation is the same as in rasters. For more information, consult the section Raster location query. It allows the reading of any raster supported by the GDAL/OGR libraries. These libraries are codes that allow the direct reading of a large number of raster formats other than those of MiraMon, as well as their interoperability, although it presents certain limitations that make complete interoperability of formats unfeasible. However, it is necessary to recognize and very positively evaluate the high capacity of interoperability that GDAL/OGR allows. For more information, the GDALMM application help can be consulted.
Open vectorThis allows you to open vector files containing point, arc,node or polygon objects). These files are in binary format (*.pnt, *.arc, *.nod and *.pol) and have an associated table (*T.dbf, *A.dbf, *N.dbf and *P.dbf) and have a file of metadata, relations and automatic symbolization (*T.rel, *A.rel, *N.rel and *P.rel) from MiraMon version 4.0. For previous versions, the file *.rel was relations and symbolization file, without metadata and, therefore there was a documentation file associated with the previous ones (*.dvt, *.dva, *.dvn and *.dvp); in MiraMon version 4.0 these are absorbed by the metadata file. For more information, consult MiraMon vector format description. Structured files are mainly designed to contain sets of vector geographic information with explicit topological relationships, that is, they describe the relationships (adjacency, containment, connectivity, etc.) between the entities they contain, which provides a much more convenient structure for information retrieval, guaranteeing properties such as completeness, spatial analysis, etc. However, structured formats can also contain sets of geographic information without explicit topological relationships, that is, both sets of entities in which no analysis or modification of their geometry has been carried out to construct their topological relationships (that is, they can be intersecting lines, overlapping polygons, etc.), and sets of entities in which the analysis of constructing topological relationships was carried out, typically from another software, but which has not been revalidated from MiraMon and, therefore, are not marked as topologically structured. In order to open a structured vector, you must first select the corresponding file (*.arc, *.pol, etc.) from the directory where it is saved. See Absolute and relative addresses. Most vector formats (such as SHP, KML, etc.) are interpreted, in MiraMon, as structured files. In this way, even if they are formats without explicit topology, it is possible to consult them based on any of their attributes and have more possibilities for symbolizing them. The specific opening box for structured vector layers ("File | Open structured vector"), offers all the vector formats that the program can open directly (without prejudice to others that can be opened by import). However, if you want a specific filter, you can use the type drop-down in the file exploration box as seen in the following figure. 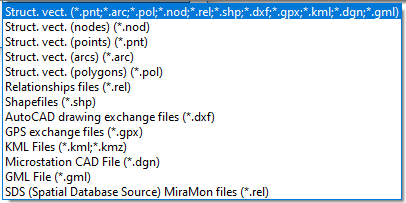 In order to visualize the structured vectors you must define some symbolization parameters (colors, fonts, symbols, etc) depending on the type of structured vector chosen (.pnt, .arc, etc). For example, in the case of PNT vectors, you will be able to choose the font to use in texts, the radius of the point, the symbology for the points, etc. For more information about symbolization, consult MiraMon symbolization. You do not need to have any loaded raster as background before you open a vector. If you open the vector over other vectors, the total zoom scope results from the addition of all scopes. If you have opened a raster or you open it later, it takes priority regarding the zoom levels and the displaying window (its upper left corner is the displaying boundary towards above and left). For more information about vectors visualitzation, consult MiraMon general visualization characteristics. All the visualization characteristics of structured vectors can be stored in a REL file with the button "Save" from the box; the next time you open this vectorial layer, the present characteristics will be automatically used as the characteristics and the box to define the symbolization will not appear. However, whenever you store a MiraMon Map composition (file *.MMM), the present visualization characteristics will automatically be those characteristics independently of the ones specified in the REL file. For more information, consult MiraMon vector format description and MiraMon map and template format description. For more information about symbolization, consult MiraMon symbolization. Location query in structured vectors: Once the raster is visualized you can query its value in any point of it simply by clicking with the left mouse button. However, the vector query cursor ( The result of a query about a vector gives information about data in relation to geometric aspects (length, perimeter, area, etc), topological aspects (initial and final node, etc) and graphic aspects (color, etc). Additionally it shows the content of the associated data base in relation to the selected graphical object. As with the raster location query, by using the The vectors query box also has enriched text, the buttons to expand or reduce the queries box, it allows you to make links with web pages, other files, etc, and allows you to copy part or all of the consulted information to be transferred to a spreadsheet, text processor, etc. 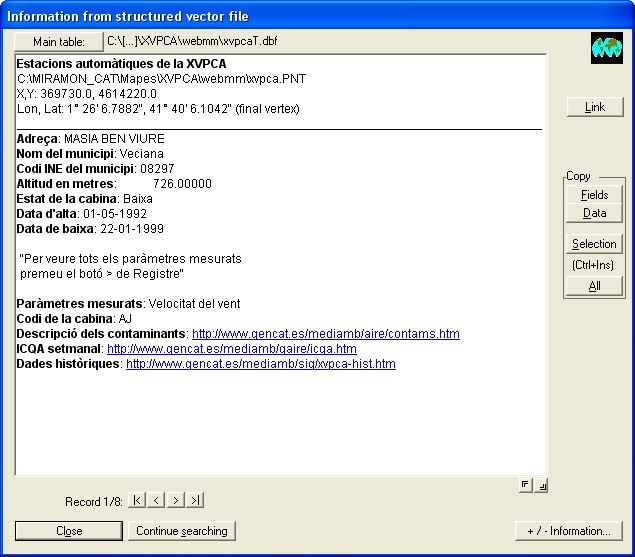 When the data base contains more than one registry for the found graphic object, the group of buttons Once an object is located, the button In the query on vectors the location process is faster if you select a vertex than if you select the segment between two vertices, and it is even faster if the vertex is the end of an arc. However, in the case of structured polygons, searching an object inside a polygon is the slowest. In short, the location of an object is, from the fastest to the slowest: final vertex, intermediate vertex, the segment between two vertexes, inside the polygon. The query inside polygons works in structured files. In the structured vectors you inquire once for each object when the button The point and node entities are shown with a black circle during the query; when you end the query, the circle will be white until the screen is redrawn. The line, arc or polygon entities are marked with the opposite color; when you end the query the color is returned to the original one. If the object is behind the information box you can move it and see the selection. Before showing the complete information on a queried vector, but after marking it visually, MiraMon can show a small box that allows you "to continue looking" or "cancel"; this is useful when you have opened many and/or complex vectorial files. This characteristic can be activated using the parameter "PreInfoBox" of the MiraMon.par file, or through the option Pre-info box (vectors) of the Information menu. The information on lengths and areas can be scaled by using the parameters "ConversorLong" and "ConversorArea" of the MiraMon.par file. The new units are indicated with the parameters "UnitLyng" and "UnitArea". The default units are those of the metadata file. This allows you, for example, to express lengths in m and km and areas in m² and ha. This allows you to open non-structured vector (points, lines and polygons). This files are in VEC ASCII format (*.vec extension), which must have an associated documentation file (*.dvc extension), for example europe.vec and europe.dvc. The atribute can be text (string), integer (short or long integer) and real. For more information about vector format, consult MiraMon vector format description. In order to open a nonstructured vector, first you must select the corresponding file (*.vec). Consult Reading files directory. As in the case of the structured vectors, the maximum number of non-structured vectors that can be visualized simultaneously is unlimited. In order to visualize the non-structured vectors you have to define some symbolization parameters (colors, fonts, symbols, etc) based on the type of object (point, line or polygon), as in the case of structured vectors. For more information about symbolization, consult MiraMon symbolization tables description. Location query in non-structured vectors: Once you display one vector file, it can be queried by simply clicking with the left mouse button. The result of a query on a vector is similar to the case of Location query in structured vectors. When you query a "line" or "arc" vector, the result is the length of the selected element, when you query "polygon" elements the result is the perimeter and the area of the selected element. Each calculated value is followed by the corresponding unit of reference taken from DVC file (for example "m" and "m²"); if you have "unknown" in the field "reference units" of DVC file, you will obtain "unknown" and "unknown²" in this information. 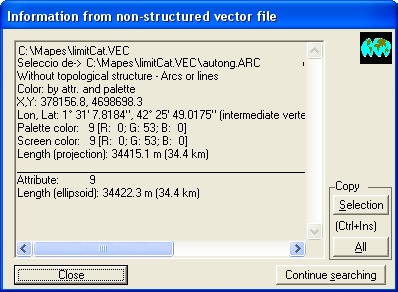 It allows the reading of any vector supported by the GDAL/OGR libraries. These libraries are codes that allow the direct reading of a large number of vector formats other than those of MiraMon, as well as their interoperability, although it presents certain limitations that make complete interoperability of formats unfeasible. However, it is necessary to recognize and very positively evaluate the high capacity of interoperability that GDAL/OGR allows. For more information, the GDALMM application help can be consulted.
Open layer in spatial database sourceIt allows to open point files stored in a table in a database from an SQL query or from the X and Y coordinate field of the point and the reference system. The submenu allows to clarify the various options: Open points in table or layer in spatial database It allows to directly open layers of points extracted from DBF tables or tables contained in databases such as MS-Access or any large manager via ODBC (SQL-Server, Oracle, XLS, etc.); in MDB and ODBC cases it is possible to define the table via an SQL query. The options are essentially the same as the BDGeomet. In case of indicate which field contains the entity identifier, it is possible to maintain the link with the original table; otherwise, a complete import of the table data is carried out. It is also possible to choose to perform a dynamic (temporary) process or indicate a destination PNT file name in order to have the point layer in PNT format permanently; in the latter case it is also possible to link the file to the original table or import all its data. In addition, the program has an intelligent heuristic to intuit which fields are plausible that contain the X and Y coordinates of each point and offer them to the user. In any of these options it is possible to save a map as well as generate an MMZ; the maps contain the link to the original table as well as the appropriate parameters (CampX, etc.) in the case of having opted for a dynamic (temporary) process, while they contain the usual vector layer parameters in the case of having opted for a complete import. All the options for saving MMM and compressing MMZ for distributing on the Internet also work with this new option. The new option also supports dragging and dropping a table on MiraMon to open it (drag & drop). Despite the convenience of this option of directly opening points located in a table, it should be remembered that BDGeomet also allows topologically structuring the imported point layer, assigning during the process a specific tolerance chosen by the user, very useful when it is suspected that some of the points may be duplicated in the database. 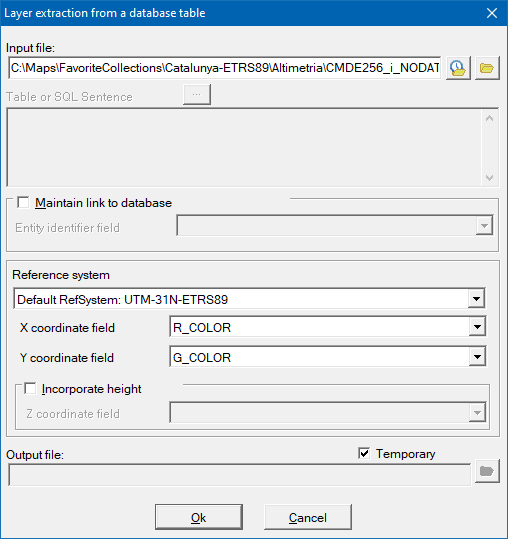 It allows to open ArcSDE layers directly. ArcSDE is an interface for accessing geodatabases developed by ESRI, which can use a database manager such as Oracle, for example. The specification of ArcSDE layers is done in the same way as for vectors, but indicating the server and other access parameters. For more information SDEMM: Conversion of ArcSDE geodatabases to MiraMon topological files can be consulted. It allows to open Oracle Spatial database tables. Oracle Spatial is an integrated set of functions and procedures that allows the user to store, access, and analyze spatial data in an Oracle database. For more information SDOMM: Import of layers in an Oracle Spatial database to the MiraMon format.
Open Internet resourcesOpen MMZX/MMZ from the Internet
Allows to open MMZ files (compressed MiraMon files) as well as their standardized evolution, MMZX files available on the internet. For more information on these formats, see MMZ. Browse OGC servers (WMTS, WMS, etc)
WMS is the Web Map Service acronym, a specification of the Open Geospatial Consortium (OGC) used for the standardization of the access to cartography across navigation systems based on Internet protocols (Map Browser Systems). A client (typically an Internet navigator) able to use WMS navigation (in Javascript, for example) can access cartography servers that follow the WMS specification, independent of the cartography provider and the manufacturer of the technology. At present there are navigation systems and servers based on the WMS standard, which can be accessed from the Internet, as for example: http://www.opengis.grumets.cat/MCSC/index.htm http://www.sigma.ad/sma/www/index.htm https://opengis.grumets.cat/wms/world/index.htm https://ide.cat/geonetwork/srv/cat/catalog.search#/home One of the most attractive aspects of the WMS specification is that it offers continuous geographical information about the layer, without sheet divisions. Therefore, MiraMon can use any WMS layer without the user having to worry about opening or closing sheets, or masaicking several sheets to obtain a certain extension. Direct access to information in local servers or through external servers MiraMon users using individual personal computers or local area networks who have access to directories (folders) where there is a catalogue of information in MiraMon-WMS format will be able to access to this information directly, without needing the http protocol if they do not want to. In other words, considering a directory with a catalogue of cartographic information in MiraMon-WMS format (typically in a server offered through the WMS protocol, to http clients that access from Internet or from the corresponding intranet), this can be seen by the clients of the local area network directly from a MiraMon session. The main advantages of accessing the WMS information directly in local servers are:
It should be noted that the speed of the network (or of the local bus in the case of a disk on the computer itself) does not imply very large differences in one or the other strategy (direct access to the local server or access to the same server via http) since the map data must also be transferred.  Choose whether the layer is on the local server or on an external server (an option that will require an Internet connection). It is possible to add layers from other servers to the browser from the server URL or from a predefined collection of servers. The capabilities of the specified service are requested, read and a window is displayed where it is possible to choose the layers to add. If it is an external server, bear in mind that most map servers provide unreliable or incomplete capability documents that require subsequent manual editing. In order to enjoy the improvements in geoservices, it is convenient to periodically execute the command "Update server capabilities". However, MiraMon maintains an updated and corrected list of WMS/WMTS layers from external servers that avoids most of these problems. To update it, press "Update server collection". This collection can be expanded by pressing the "Add" button. In order to insert an external server, enter the URL address, version, file name and title (descriptor), or, if it is an XML file, the path and title. Using the "Delete" button, you can remove the server from the server collection. To open a layer from an external server, choose from which server the WMS/WMTS layer will be opened. MiraMon opens a new dialog box, from where the user will have access to the layers from that server. Choose the layer from the drop-down menu, the format (if more than one is available), the style, the minimum and maximum display scale, as well as other aspects such as semi-transparency, opacity in the NoData areas, etc. Important: Given that many WMS servers limit the scales in which the layers can be displayed, it is possible that you won't visualize the WMS layer on the screen or when printing it. If you have this problem, contact the server manager in order to relax the scales between which it is possible to request the information.  Users of WMS information in the Internet know that one of the most frequent defects is the lack of quality when printing occupies a relatively large surface area of paper (A4, A3, etc). This is due to the fact that WMS specification is essentially thought to satisfy the on-screen information needs of Internet users. In the MiraMon implementation a maximum quality print is obtained because the necessary resolution is needed in the WMS server (either a MiraMon server or another provider) to extract all the original information given the resolution of the printing device. The WMS layers are joined to the created MMM. Considering the special nature of the WMS layers (normally enormous volume, access from URL paths, etc), when a MMM is turned into a MMZ, these layers are indirectly referred to, but are not incorporated into the MMZ file. If you are managers of a MiraMon Map Server it is important to know that the process to create and to prepare WMS layers is done with the CreaMMS application, which prepares the layers in a very optimized structure to obtain quick access in any geographical field and work scale. The files that make up the layer, its relation model and its characteristics are defined in files in REL5 format, (see hereinafter). The file system can be organized in the way the manager of the WMS layers wants; however, it is recommended to follow a system such as the environmental tree of the Departament de Medi Ambient i Habitatge de la Generalitat de Catalunya (SIWeb). However, the reading and visualization of WMTS layers written directly in REL5 format has also been implemented (previously, WMTS layers could only be opened through Internet or intranet geoservices, but not from files described in a REL5 structure). This makes it easier to have large databases (for example orthophotos) accessible directly on the network or on the local disk as files, without having to go through Internet protocols, which makes their access much faster. Open other maps and layers from the Internet (ECWP) This option allows you to open non-WMS / WMTS layers available on the Internet, such as ECW files accessible via ecwp: // protocol and ArcSDE geodatabases. As for the list of hundreds of MiraMon maps distributed over the Internet (MMZ), you can find them in one of the icons in your favorite collections. Open KML or KMZ from the Internet Allows to open GoogleEarth KML or KMZ files available from the Internet. For more information on these formats, consult KMLMM.
CloseThe new window closer, also accessible with the key combination Ctrl + button 
Save mapSaves as a map the set of raster and vector files currently loaded. Saving a MiraMon Map is an operation totally independent of the fact that some raster or vector files could proceed from other loaded maps: A MiraMon Map does not store other maps, but rather the basic raster and vector files you are looking at. Therefore, you can open two maps (Map A and Map B) and three other vector files (a, b and c). Imagine that you close one vector file from Map A because it has too much information and then you save a new map (Map C); this map will link the set of files of Map A (except the closed vector file), the entire set of files of Map B plus the three vector files (a, b and c). Note that information in MMM files takes priority over other information, such as the information contained in the REL file of each layer. That is to say, even though each layer automatically has visualization conditions, that are applied when the layer is opened directly (for example through "File | Open structured vector"), with a certain combination of files kept in a map, that layer can have other visualization conditions if necessary. For example, if the hypsA.rel file specifies that the color of the relative hyps.arc file should be indexed by the palette, but prior to saving the map you select constant color ("View | Change palette color, etc") because in this composition you prefer a constant color for all the arcs, the next time you open this map, the hyps.arc will be shown with the selected constant color. One of the most interesting aspects of MiraMon Maps is that they can contain information related to all your printing parameters (scale, map area to print, reference grid, sheet boxes, logos, etc). For more information, consult MiraMon map and template format description. Do not hesitate to save MiraMon Maps whenever you feel they will be useful for you later. Among the uses of MMM files, remember these cases:
The normal way for building MiraMon Maps is loading raster, vector or map files and saving them all together as a new map. Nevertheless, occasionally it can be useful to manually edit the MMM files; for these cases, you can find technical information in MiraMon map and template format description. The following are some examples in which it can be useful to edit the MMM files:
Before saving a Map, MiraMon shows what type of information the file you have loaded contains so you can indicate the information you want to keep (for example, the title of the map, reference frames and font for the map legend when printing, coordinates of the map face to print, reference grid, etc). 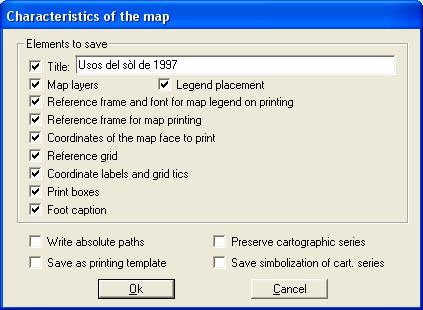 MiraMon saves the map by writing the paths of the files in relation to the file that contains them. However, MiraMon also offers the possibility to save a map by writing absolute paths, which can:
For get more information, consult Absolute and relative paths. Another option that MiraMon allows when saving a map is to preserve cartographic series. Automatically, these follow the same criterion as the individual layers: the specifications of the MiraMon Map (MMM) prevail over those indicated by REL of the series. When we save a map, MiraMon writes the visualization conditions of each layer in that moment and any link with the individual REL or series is lost unless you activate the option "Preserve cartographic series". In this case, the visualization conditions indicated in the REL of the series prevail. If you have modified the layer symbolization and you want to keep these changes for all the cartographic series, it will be necessary to activate the box "Save symbolization of cartographic series. For more information, consult MiraMon cartographic series. In addition, MiraMon allows you to choose the option "Save as printing template". This is useful when you want to save a template in which you have specified some elements such as the reference frame and font for the map legend in the printing, reference frame for map printing, print boxes (title, graphic scale, numeric scale, north arrow, logo) etc, that you want to be in new compositions. The positions and size of the elements of a template are saved in paper coordinates (mm) so that they are independent of the map modifications (for example in a change of scale, size of paper, etc). Moreover, when the coordinates are expressed in page units (mm), character size is expressed internally as conventional typographic points (exactly as they are displayed in the Windows dialog box where the font is selected). You can save templates in the subdirectory "Templates" in the MiraMon directory. For more information about MiraMon templates, consult the section MiraMon templates in the MiraMon map and template format description.
Save raster/WMS or WMTS as rasterWrites the raster map or WMS/WMTS view that we are currently viewing to disk. Saving a raster/WMS in another format is a suitable option for: - Interactively extract a window of interest from a larger map. - Save in 8-bit format and with a color palette a certain RGB composition that we are interested in; this way the next RGB -> 8-bit reading will be much faster. Important: in this case, once you have saved the raster as IMG, you will have to save the palette (File | Save palette or symbolization table). - Export various formats to IMG interactively without using import/export tools The export possibilities depend on the source format, as shown in the following table.
* The spatial resolution obtained is chosen by the user. In all other cases it is the maximum resolution available, not the screen resolution. As can be seen in the table and the following figures, in some cases the entire raster or only a view can be saved. The choice of format is decided in a box like the one shown below or in the drop-down of the Windows file navigation box.   If the combination shown in the table is not exactly what you need, you can obtain it later using, for example, export them as a file of type BMP, "File | Import | JPEG - >IMG/ BMP" (which has a BMP to JPEG transformation mode), etc. Note that some of these formats are not suitable as "complete information" since they do not allow the use of integer, long or real data types. Therefore, we recommend using this option when we are interested in exporting the map in the form of an illustration (BMP, etc.), of correct appearance, but in which we may have lost important cartographic and alphanumeric attributes. This is one of the ways to export to sophisticated drawing programs, where you can refine final editing and printing aspects. In the case of WMS/WMTS navigation, the user can choose to save the view as a raster or as a WMS slice, maintaining the pyramidal structure by creating the corresponding directory tree and using the same philosophy of REL5:  In the option to save as a raster, the accepted output formats are JPEG and BMP and in both cases it is possible to choose the output pixel side:
Save palette or symbolization tableIt writes to disk any of the symbolization tables (color palettes, frames, etc.) that are currently being used (for raster or for vector). It is recommended to save the symbolization tables in DBF format (256 levels per RGB component) although other formats are also allowed such as PAL (64 levels per RGB component), P25 (256 levels) and P65 (65536 levels, not useful in Windows environment). "Save palette" is useful in the following cases:
Internet/Intranet map publishingCreate/Uncompress an MMZX/MMZIt allows to create compressed maps of MiraMon (MMZ or MMZX) for exchange between users or for publication on the Internet. Run the MiraMon MMZ support module (Compression and uncompression of MiraMon files). The program can compress/uncompress all files in a directory or all files linked to a map. It is also the right tool for generating certified maps. Certification is very convenient for generating maps that can be distributed over the Internet; but it is only available to those users who have MiraMon Internet Map Publisher. For more information, see the MiraMon MMZ Support Module. To publish and/or export open vector data or any vector or map file that contains vectors, MiraMon incorporates an open data publisher in the MiraMon session (or other than the user chooses) in several formats. This tool, called PUBLICMM, allows, from a vector or a map, to generate an MMZ or MMZX (certified or not) with the source data that has been indicated and/or one or more SHP files with symbolization in one or more files following the OGC v.1.0 SLD standard and one or more XML files with metadata in ISO19139 format. The publisher can be opened from a button on the MiraMon toolbar or from the command line. Through the Miramon.par file, the user can configure whether the standard button bar is desired to appear in the MiraMon sessions or a special one that includes an additional button that allows calling the "PublicMM" window. In the "MiraMon" section, there is the "Special ButtonBar" key, this key can be 0 or 1. If 1 is indicated, it means that the special button bar that includes the additional button that allows the publication/export of MiraMon vector maps is desired. If 0 is indicated, it means that the special bar is not wanted and that therefore the standard bar will be used; this is the default value. [MiraMon] BarraBotonsEspecial=1 Pressing the new button a window appears to allow to select one of the open layers (vectorial or Map) or a file and indicate if an MMZ, SHP, etc, has to be generated. The window has an area where messages are displayed as the files are generated, so that if there are gaps in the metadata, they are written so the user can copy and correct them. This new option can also be invoked on the command line with these new parameters: /PUBLICMM (which indicates that the user wants to publish some of the layers to be opened), /MMZ= (which indicates the name of the MMZ or MMZX to generate), /SHP= (which indicates the name of the SHP to generate), /XML19139 (which indicates that the user wants to generate the metadata in XML) and /SLD (which indicates that the user wants to generate the symbolization in SLD). Note, however, that exporting to non-MiraMon formats may result in the loss of potentially important features, including: 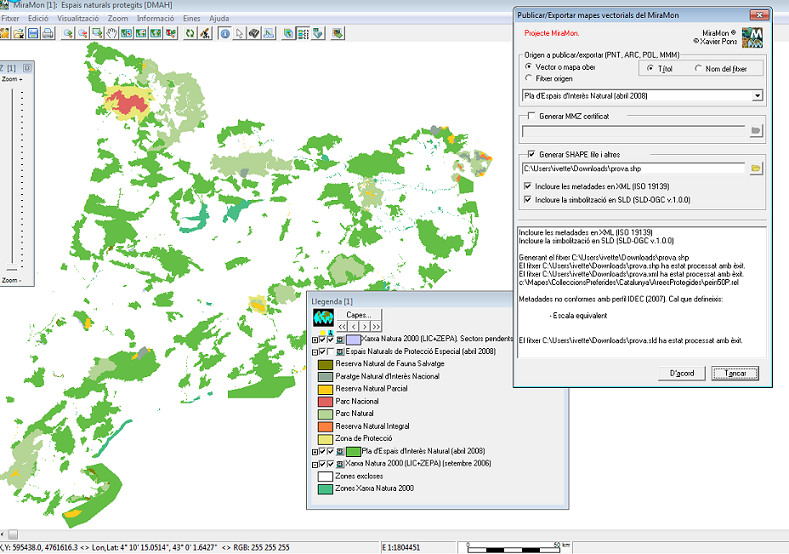 It allows to generate a web page with a sensitive map from a VEC file of polygons, POL or PNT and a raster image in GIF or JPG format. In case of working with a POL or PNT file, it is possible to define the properties that the sensitive areas of the map will have based on the information available in the metadata. For more information, it is possible to consult the application help. Vec2Map. Administrate an OGC client or server (WMS, WMTS, etc)At the moment the option "Manage an OGC client or server (WMS, WMTS, etc)" is disabled pending future versions. Create a WMS/WMTS zoom levelIt allows to prepare a point layer to be displayed as a raster zoom level on the MiraMon map server. Since the pre-prepared zooms are faster than those interpolated directly by the program, all the zoom levels that the browser is most likely to offer have to be prepared. Generally, multiple zoom levels of 1, 2 and 5 are prepared. For more information, it is possible to consult the application help.CreaMMS. Create a KML or KMZ (Google Earth)It allows to create a map with a point layer (PNT), which contains KML objects of type 'Point', a line layer (ARC/NOD) for KML objects of type 'LineString' and a polygon layer containing objects of type 'Polygon', if any. Objects of type 'MultiGeometry' or 'LinearRing' that are not part of a polygon are not considered. If there is information about the Z of each vertex, it is also converted. The layers are not structured topologically. For more information, you can consult the application help. KMLMM.
ImportThe import menu options run some MiraMon Support Modules (MSA) that allow the user to import different raster, vector and tabular formats. Import to MiraMon raster formats (IMG, JPG, etc.): In the case of BMP, all files can be read directly in MiraMon via "File | Open raster" indicating BMP extension. In order to convert the file to IMG later, it must be saved via "File | Save raster/WMS or WMTS as raster" by choosing the "All raster" option. In the case of IMG (Idrisi), all files that are binary and uncompressed can be read directly into MiraMon via "File | Open Raster". If the file is ASCII or packed, it must be converted to uncompressed binary using the "CONVERT" Idrisi utility (for ASCII can also be used, from MiraMon, "File | Import| TXT (ASCII) -> IMG"). Import to MiraMon vector and tabular formats (VEC, PNT, ARC/NOD, etc): All Idrisi VEC (ASCII) files can be read directly in MiraMon via the "File | Open non-structured vector" menu. If the VEC file is binary, it must be converted to ASCII using the "CONVERT V " utility of Idrisi. In the case of VEC (Idrisi) files, to convert them to MiraMon structured files (PNT, ARC/NOD, POL) use the "Edit | Buid topology" tools. It allows importing raster, vector and tabular formats into MiraMon formats using the GDAL/OGR libraries using the GDALMM application. In the future, it is expected that the application will also allow exporting the aforementioned formats; in the meantime, the GDAL libraries https://trac.osgeo.org/osgeo4w/#QuickStartforOSGeo4WUsers can be installed to execute instructions such as ogr2ogr. The GDALMM application help can be consulted for more information.
ExportThe export menu options run some MiraMon Support Modules (MSAs) that allow to export from MiraMon formats to other formats. Export of the MiraMon Map format: To export MiraMon maps to Enhanced Metafiles (EMF) or Metafiles (WMF) (MMMEMF aplication), select "File | Print" and after configuring the appropriate parameters (map field, scale, etc.) press the button Export MiraMon raster formats to:
To save an IMG file or RGB composition as a Windows bitmap , open it with MiraMon via "File | Open raster" or "File | Open RGB-> 24 bits" and run "File | Save as BMP". All uncompressed, bit and long MiraMon IMG files are directly supported by Idrisi . To convert bit, long or compressed files to Idrisi run "Tools | File maintenance | Raster conversion and compression/ uncompression". Export of MiraMon vector and tabular formats to:
In the case of unstructured MiraMon vectors (VEC), all files are directly compatible with Idrisi (VEC) files and therefore not export is required, except for string and integer attributes with out-of-range attributes [-32768,32767]; in the latter cases, the attributes must be reclassified to one of the types supported by Idrisi (short integer or real). In case of exporting structured MiraMon vectors (PNT, ARC/NOD, POL) to Idrisi (VEC) files open the structured file ("File | Open Structured Vector"), select all entities ("Info | Query by attributes", GRAPHIC_ID >=0) and save the selection as a VEC file. To convert PNT-> VEC and ARC-> VEC use the "Points" and "Arcs/Nodes" options in the "Edit | Build topology" menu.
This prints the map (rasters and vectors) displayed on the computer screen. The printout may incorporate external elements in the form of boxes, graphic scales, legend, logos, boxes explaining the process, etc. Designing the page is a complex process with many intervening parameters, some of which play complementary roles while interacting with each other. In cartography a precise control of each one of these parameters is essential when it is to print maps. In order to create a composition that can be printed, MiraMon offers several possibilities inside the box Sheet printing parameters:
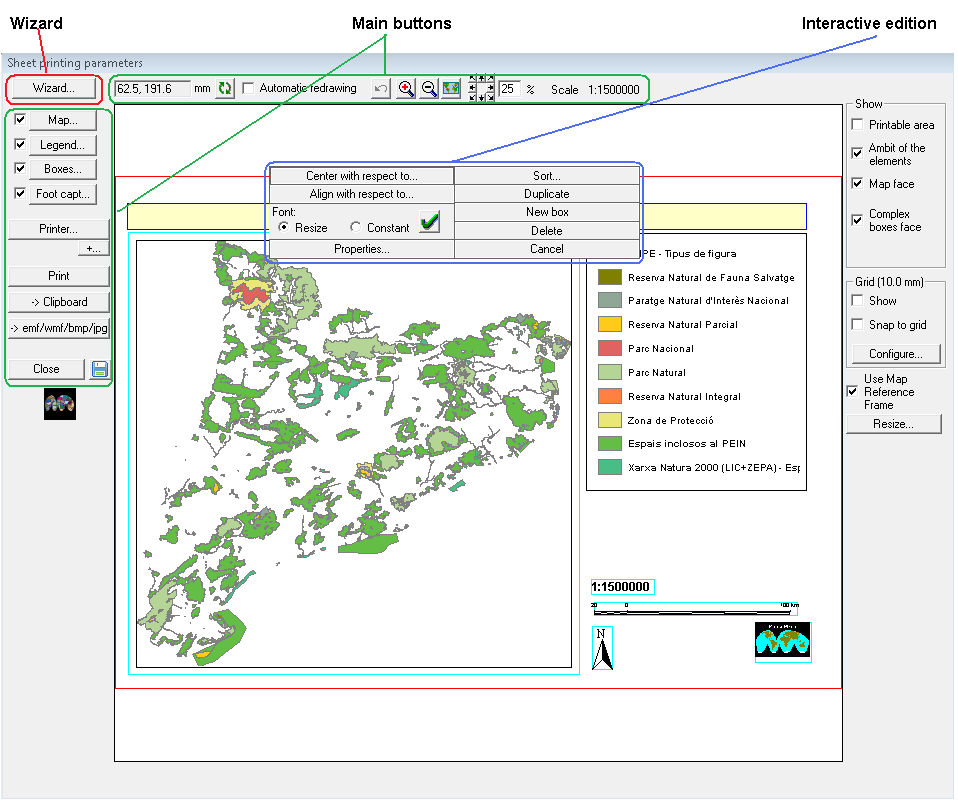 MiraMon offers the possibility of creating a composition for printing using the Printing wizard which is the recommended option when starting a printing design, followed by Interactive editing of the composition elements and, if necessary, keyboard editing through the Main buttons. The printing wizard is structured in 4 steps that are described below:
Defines the current printer and the paper dimensions in mm and its orientation. The printing parameters used by MiraMon the first time the user accesses this menu (the printer model, paper orientation, number of copies, etc.) are those of the default Windows printer (configured through the Control Panel). The "Change printer or paper" button allows to change these parameters within the current MiraMon session. The "+i..." button provides information about the selected printer (paper size and orientation, printable surface, resolution, paper dimensions, etc.). 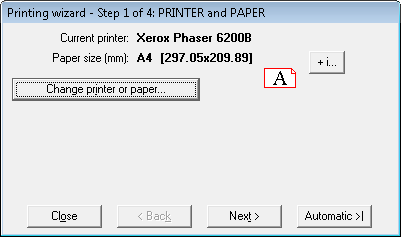 Defines exactly the map coordinates that delimit the area to be printed, expressed in the map units of the reference system used (m, km, etc.). Do not confuse the map field with the reference frame, since the latter only limits the area where we can print (that is, the origin and dimensions of the rectangle in which the printed map or map field will be framed). For more information on the difference between the map field and the reference frame, see Reference frame. In most cases, however, it is better not to use the reference frame. MiraMon allows you to define the map field in several ways: 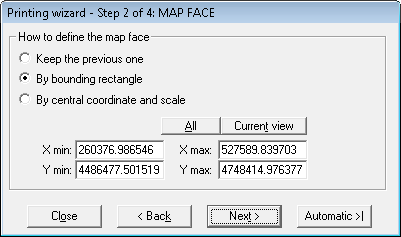 It should be noted that the successive execution of the wizard does not duplicate the boxes in the template over those you already had: if the names already existed, the old ones are deleted because it is understood that those in the wizard template are desired. However, you can select the "Keep the previous one" button in step 3 of the wizard so that it does not read any template. With these four steps, the wizard for printing is completed, obtaining a preview of the map as shown below:  Although it is possible to run the printing wizard repeatedly, it is only recommended to do so the first time we start the design, to continue with the interactive editing of the elements of the composition (see below) or with the keyboard editing through the Main buttons in order to finish adjusting the elements of the composition. At the end of the following block, the result of the composition is shown once the interactive editing of its elements has been carried out. Main buttons for printing maps: The box of Sheet printing parameters has the tools that allow you to correctly print the chosen elements (map, boxes, legend, etc) without needing to use the wizard. Nevertheless, if it is the first time that you are printing the map, the wizard will be very useful. Next we will describe all the elements of this box to explain how they operate:
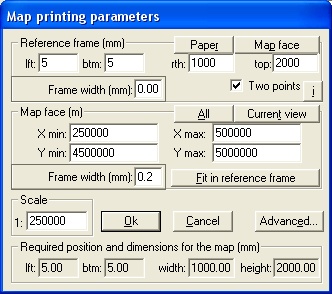 -Reference frame: This allows you to indicate the origin and the size of the rectangle in which the printed map will be framed (width and height wished and its situation). These parameters are expressed in paper units. You do not have to confuse the reference frame with the field of the map. The first one only limits the area where we can print inside the limits of the chosen paper (that is to say, origin and size of the rectangle in which the printed map will be framed). The map face, however, indicates the area of the map that you want to print. 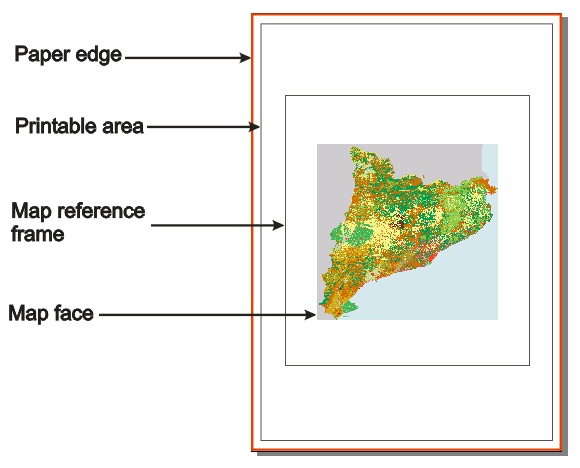 The button "Paper" allows you to indicate that you want to convert all the paper into the reference frame (that is to say, that your reference frame can be potentially all the sheet). It is important to realize that the reference frame not necessarily will be occupied by mapped area. The reference frame only limits the area where we can print a mapped area, but if we indicated a map face (with coordinates) a scale of printing that does not require all the scope of the specified paper, MiraMon will automatically centre the map field within the reference frame. This is particularly useful when cartographic series are printed in which the map field of each sheet is not always occupied exactly by the same surface (for example, when the map is by geodesic coordinates, the zones next to the Poles occupy less area); in these cases the reference frame can always be the same in the printed sheet and the program will properly centre the map field for each sheet. This facilitates the design of cartographic series. Another application of this property is to define a reference frame in which a map is centered is in the standard generation of reports on forms: we will always use the same reference frame and, inside it, the generated maps will be located, which will in the centre although they always do not have the same sizes and/or proportions. The button "Map face" allows you to make exactly coincide the reference frame with the map face. This case is useful when you have already fixed the coordinates of the map and the scale of the map face and you want to place it again in the sheet. Because when you select this option the map face and the reference frame are the same, the map face is not put in the center of the reference frame. In order to place the map face from this box (to place it with the mouse interactively, consult the Interactive edition options of the composition elements), you must fix four parameters. When the button "Two points" is disabled, the four parameters to introduce are:
When the button "Two points" is activated the four parameters are referred the bottom left corner of the paper and, therefore, it is necessary to indicate:
Note that if the button "Two points" is activated, a change in the (bottom, left) position will involve a change in the width and height of the reference frame. In contrast, if "Two points" is disabled, width and height will remain constant. A change in the (bottom, left) position will move the whole reference frame. If you publish with the keyboard the boxes of print area, and these values exceed the available one of the printer, MiraMon offers automatically to solve it with the value proposed by using a message similar to the following one: 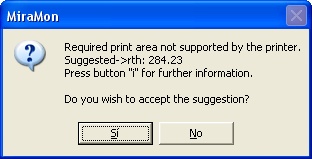 Remember that the printer information button "i" is available in case you need orientation concerning the printable area, margins, etc. If you wish it, the reference frame can be drawn with black line. This sometimes is useful as a second map frame. The width of this line is indicated, in paper units, in the field "Frame width". If you do not want the line appear on the page, set line thickness to 0. -Map face: allows you to provide an exact definition of the map coordinates that delimit the area to be printed. They are expressed in the map units of the horizontal reference system (UTM-31N-UB/ICC, etc) that you are using at that moment (m, km, etc.) and can be edited freely within the coordinate scope of all files loaded on MiraMon (you may print zones even if they are not on the screen at that moment). The buttons "All" and "Current view" make coordinate choice easier in two of the most frequent cases: if you want to print a general view of all the files loaded at one point ("All"), or if you wish to print everything displayed on the screen ("Current view"). When one of the two buttons is pushed, MiraMon performs the following operations: - It fills the edit boxes X min, X max, Y min, Y max with the coordinates corresponding to the general view or to the current view. - It estimates the scale required for the map to use the maximum space within the reference frame previously defined. - It updates the read-only boxes "Required position and dimensions for the map" to allow the user to see how much space the printed output will take and where (on the page) it will be printed. If "Two points" is disabled, you may observe that either the area required in X coincides with the maximum width selection or that the area required in Y coincides with the maximum height selection, but not both. It is normal to find a mismatch between one dimension (X or Y) and the corresponding maximum dimension selection. This is due to the fact that the reference frame specified will very rarely have exactly the same X/Y proportions as those of the set of loaded files or of the current view. If you introduce no further modifications, the map will be adjusted completetly to one of the two selected maximum dimensions, and will be centered with respect to the other. Nevertheless, in some cases you may want the map to have some empty space all around it, rather than only along whichever dimension does not occupy the selected maximum space. Two options are available: - enlarging the scale denominator slightly and/or - reducing the map area to be printed (increasing X and /or Y min and/or reducing X and/or Y max) The "Add buffer" button is an intuitive mechanism that facilitates the process of modifying the size of the map to be printed and that it presents margins all around. Therefore, by defining the percentage (%) or the map units (typically meters) that the user wishes to give a margin (reduce the map), the map is displayed smaller, without the need to calculate a new scale and area of the map to be printed, which are more difficult parameters to determine. The program internally performs the same double action to achieve the effect of buffer: increasing the value of the scale denominator (therefore, the map is displayed smaller) and expanding the geographic envelope around the 4 corners (therefore, more map is displayed all around, as long as there is map available in each corner: otherwise, the area remains blank); In no case is the area that the mapped part will occupy on the paper (reference frame) expanded. Once the value is defined in the box and the mode selected (map units -typically meters- or percentage) you must press the "Add buffer..." button to apply the changes. Otherwise (if you press "OK" directly) the give air option will not be applied. The result will be a map, for example, 30% smaller, with a new scale and envelope. Once the desired view is obtained, we can adjust the print scale to a "more rounded" or conventional value of extreme coordinates and/or scale (for example, avoid printing at a scale of 1:2412600.87 and do it at 1:2500000). When the final scale chosen (the "rounded") is less detailed than that obtained with the application of "give air" of 30% (as in the example shown below), the envelope is not modified. If the final scale chosen is more detailed, MiraMon will ask you what you want to do (manually edit the reference parameters, increase the reference frame, establish a new less detailed scale, etc.) since the map field exceeds the reference area. As it is an intuitive process, we recommend that you reduce the area of the map to be printed, which will reduce the margin that you initially set (in the example, give air = 30%). Below is an example of applying the option to give air to an overview.
Other cases in which it may be useful to apply this option are when some point symbols do not fit in the print display (they are cut off by the edge of the map field itself). Giving a little air is again a more intuitive/easier way to play with expanding the envelope (increasing the denominator of the scale, instead of expanding the area it will occupy on the paper) until we obtain the desired view. In other cases you may want the map to fill the reference frame completely. The button "Fill the reference frame" tries to adapt the map face to the reference frame while preserving the map's scale and avoiding to move its geographic center from its location on the page. MiraMon displays a message if the filling process implies violating any of the two rules, as the following: 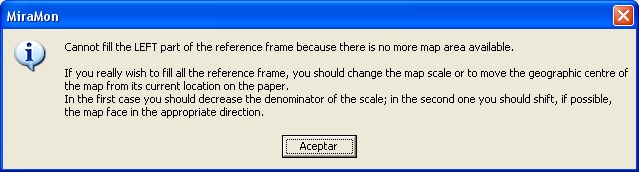 If you are introducing values in the edit boxes X min, X max, Y min, Y max or Scale using the keyboard, you will notice that the read-only "left", "bottom", "width" and "height" in "Required position and dimensions for the map" are updated automatically as you type. Although the latter edit boxes are mere containers of information, they are very useful for controlling the map face dimensions and position of the map that you are trying to print. If the map face exceeds the reference frame MiraMon offers, among other solutions, the possibility of executing the priting wizard. 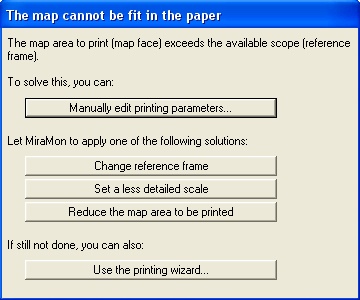 If you decide to increase the reference frame to give capacity to the map face and the scale you request and this exceeds the size of the selected paper, MiraMon indicates the necessary paper (A2, A1, etc). If you decide to set a less detailed scale, MiraMon calculates the scale to solve it. If you decide to reduce the map area to be printed, MiraMon includes the maximum scope that, on the scale you have set, can give capacity, maintaining the geographic center of the map. As in the case of the reference frame, you can draw a frame, that will be printed exactly around the specified coordinates of the map. Normally this frame is drawn as fine as this allows the printer (typically between 0,1 and 0,2 mm); also you can indicate 0 not to print this frame. -Scale: It allows you to manually modify the denominator of the scale. This option is specially useful if you do not want "to round" the value of the scale. In case that you assign so detailed scale tha the map field has not enough space in the reference frame, MiraMon offers, among other solutions, the possibility of executing directly the printing wizar opening the box of aid "the map does not fit" commented in the previous section. -Required position and dimensions for the map: It allows you to know the map face dimensions and position of the map that you are trying to print. Finally, the button "Advanced..." allows the user to activate special printing options. They are the following: 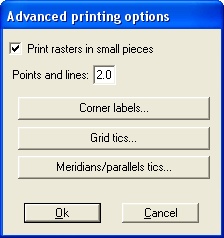 -Printing rasters in small pieces: The drivers of certain printers either cannot print large rasters or print them incorrectly. In such cases try activating the button "Print rasters in small pieces". The only drawback may be, and not always, a slower printing speed, so this option is highly recommended. You can also let the option be activated by default by means of the parameter "PrintRastersEnPaquetsPetits" in the file MiraMon.par. -Exaggerating points and lines. The box "Points and lines..." allows you to type in an exaggeration factor for the radium of points and the thickness of lines. This is a useful parameter for high resolution printers (300 ppp or more), in whose output points can become too difficult to see and lines too thin. It is also interesting when lines have to be in a non-pure colour, since it improves the quality of their dithering. Attention: when in a given file line thickness or point radium are indicated in map units, MiraMon does not apply any exaggeration factor so as not to misrepresent the real size of the object on the ground (for instance, if the thickness of the line representing a road corresponds to its real width, no exaggeration is applied). -Corner labels. This option opens a new dialog box to specify which of the coordinates of the map face corners should be printed. The button "Font" allows you to choose the size, colour, etc. of the selected font. By using the parameter "Divisor" the corners can be expressed as multiples or submultiples of the ones used in the map. The parameter "Decimal places" indicates the number of decimals that will appear. For instance, if Divisor=1000 and Decimal figures=1, the coordinate 374500.000 will be printed out as 374.5. We can specify the coordinates in map units (typically in meters of the projection system) or in longitude/latitude (the choice of whether in degrees, minutes and seconds or in degrees and decimal fraction of a degree is made in the "Information/Advanced information options" box in the "Longitude/latitude coordinates" section).
-Grid tics. This option is available only if a reference grid has been activated through the menu "Visualization | Reference grid". If the map has a reference grid, this button opens a new dialog box where you may specify on which of the four sides of the map face you want the coordinates of each reference grid line to be printed. Small continuity lines of the reference grid are then drawn on the selected sides and the corresponding coordinates are printed at those lines' ends.
The external appearance of these values can be controlled through the parameters "Font", "Divisor" and "Decimal places", which have the same function as in the corner labels box, although their values are independent from those (that means that the corner labels can be set to appear in metres, with two decimals, in blue size-6 characters while the grid mark labels can be set to appear in kilometres, with no decimals, in black size-8 characters). In those cases where corner labels and grid mark labels occur together, MiraMon will avoid overlapping values: in case of conflict, one or more grid tics are not printed. -Meridian and parallel marks: This option is only accessible if we have a meridian and parallel network activated through the "View | Meridian and parallel network" menu. If the map presents a meridian and parallel network, this button opens a new dialog box where we can specify on which of the four sides of the map field we want the coordinates of each line of the meridian and parallel network to be printed. On the chosen sides, small lines of continuity of the meridian and parallel network will be drawn and the corresponding coordinates will be written at their ends.
To summarize, the following protocol can help you in the task of determining the map printing parameters (it is not necessary if you use the printing wizard): 1. Zoom in on the area that you wish to print. Before entering the print option on the File menu, bring the map area to be printed to the screen. Use the tools in the zoom menu and resize the application window if needed. The adjustment need not be perfect: fine control can be achieved later from the Print menu through the map coordinates and scale. This previous step is by no means obligatory, but renders the process much easier. 2. Decide the location of the map frame on the page. Go to "File | Print | Map" and start by setting the location of the reference frame by using the "Reference frame" button. The values provided by the program are those of the whole paper sheet (unless you have opened a map that specifies other values or unless the values have been modified within the current MiraMon session). The button "i" provides information about the highest values available. In print preview mode, if the cursor is moved around in the simulated paper sheet, it works as a ruler: as it is moved around, its position is indicated by MiraMon in mm. 3. Select the area to be printed. Push the button "Current view" to see the view displayed at that moment on screen inside the previously specified reference frame, filling the frame in X and/or Y. If necessary, make slight modifications in the map coordinates and/or scale in order to "round up" values or to adapt them more exactly to your needs. Bear in mind that you should tend to reduce the map area selected for printing and increase the scale denominator. Otherwise you will cause the printed map to exceede the boundaries of your own reference frame. You can control this process through the values given in "Required Position and dimensions for the map". The required area should not exceed the width and height that you provided as reference frame. MiraMon will center the map area selected for printing within the reference frame. The button "Map...", just as the buttons "Legend..., "Boxes..." and "Foot capt..." can be activated (
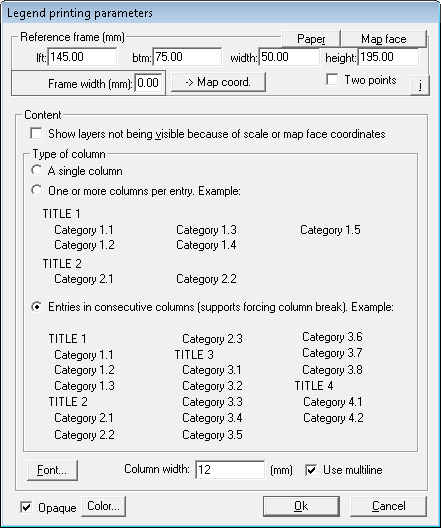 As in the case of map parameter edition, the buttons "Paper" and "Map face" help you define a reference frame for the legend (for all the scope or only for the map face). You can incorporate a frame around the legend box (in paper units) and activate the button "Two points" to define the coordinates with reference to two points (remember that the parameters to define the size and location of the legend are expressed in paper units and that the distances are given with reference to the left bottom corner of the paper). For more information, consult Map reference frame. Remember that you can edit the legend interactively in order to define its location, size, font, etc. The button "-> Map Coord. " allows the conversion into map units (for instance m); observe then how the title of the parameter group changes accordingly and the button indicates the possibility of conversion back into paper units (if you push the button "-> Paper coord."). Important: whether a box is set with reference to map coordinates or to page coordinates affects how MiraMon processes its position: if it is referred the paper, location and size will not change if we changed the map scale, whereas it will change if it is referred in map coordinates. In addition, when the coordinates are expressed in page units (mm), character size is expressed internally as conventional typographic points (exactly as they are displayed in the Windows dialog box where the font is selected). In contrast, when coordinates are expressed in map units, character size undergoes changes in its scale as the map scale changes, since it is internally saved in map units (although it is always given in typographic units in the dialog box). Several options are allowed in relation to the content of the legend:
In all cases, the use of multiline is allowed. The titles of the different legend layers are represented in the same size than the legend entries, but in bold face. Remember than these titles can be changed from the Legend box in MiraMon (F11 and double click on the left of the layer title). For more information, consult Visualization of the layer in the legend.
It is also possible to create a new box interactively from the print module window from a relative position (bottom, top, left, right or centered) from the right-click. It is also possible to define this position relative to the last box when a new box is created from the print box management window. 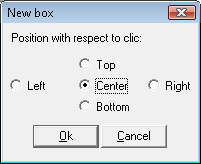 This dialog box offers four options: -New: this allows you to create a new box. -Edit: this allows you to edit a box previously created or made with the printing wizard. -Remove: this allows you to remove a box; before you do so you are asked to confirm. -Close: this allows you to return to the main printing menu (Sheet printing parameters). For each box (even if it is new or if it is a pre-existing box) you can define: 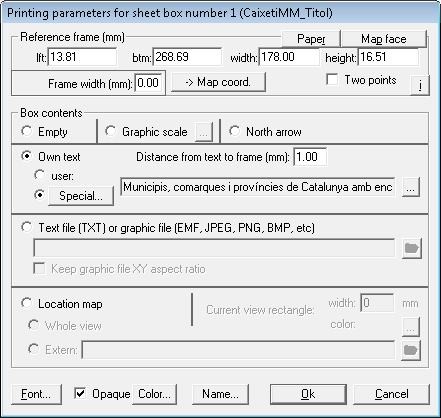 -Reference frame: The definition of the reference frame of the boxes is similar to the definition of the reference frame of the map and of the legend. As it has been explained before, the buttons "Paper" and "Map face" help you define the reference frame of the box (for all the paper or only for the map face). You can incorporate a frame around each box and activate the button "Two points" to define the coordinates with reference to two points.For more information, consult Map reference frame. Remember that you can edit the boxes interactively to define its location, size and also to choose the font size. When editing a box, simply remember that distances are given with reference to the page's bottom left corner, in page units. Therefore, the button "-> Map Coord." allows the conversion into map units (for instance, m); observe then how the title of the parameter group changes accordingly and the button indicates the possibility of conversion back into page units: "-> Paper coord.". Important: whether a box is set with reference to map coordinates or to page coordinates affects how MiraMon processes its position. For instance, on a standard report template it is necessary to leave logos and form-boxes, etc. with reference to the page, since the coordinates of the maps to be printed will vary; in contrast, when a box contains a metafile which in turn contains an arrow pointing at an element in the map, its position should be given with reference to map coordinates to ensure that if you change the scale, the arrow will continue pointing at the same element. When the coordinates are expressed in page units (mm), character size is expressed internally as conventional typographic points (exactly as they are displayed in the Windows dialog box where the font is selected). In contrast, when coordinates are expressed in map units, character size undergoes changes in its scale as the map scale changes, since it is internally saved in map units (although it is always given in typographic units in the dialog box). -Content of the box: The content of a box can be: -Empty: simply a rectangle which can be used as a second frame for a picture, or for the map itself, or to define blank areas on a form for field work, etc. -Graphic scale: MiraMon allows you to choose the units you want to express the distances in the graphic scale (kilometres, miles, yards, etc), the number of subdivisions to the right and left of the zero in the graphic scale, the width of each division (in the units chosen previously), as well as the visual aspect of the graphic scale. It is important to note that the graphic scale is dynamic, and therefore if you modify the scale of the map, the graphic scale is also modified. 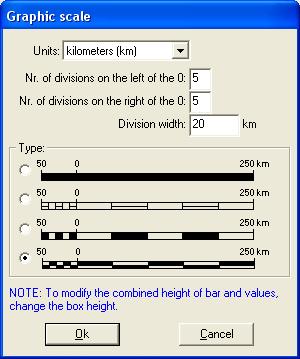 -North Arrow : This allows you to introduce the icon of an arrow pointing to the north. -Own text: MiraMon allows two types of texts "User text" and "Special text" and in both cases you can centre it or align it to the left or right. In the first case, you can write the text that you wish, whereas in the second case, you can choose redefined texts, which MiraMon manages dynamically, such as for example "Map Title", "Numeric scale", "Printing date" or "Printing date and time". In these cases MiraMon will print the map title (which appears in the bar of the program), the scale used, etc, so that if you introduce a change to some of these concepts, MiraMon will update it for printing. These special subtypes are marked internally by MiraMon through a special name for the box (CaixetiMM_Titol, CaixetiMM_EscalaNumerica, etc). Therefore, a box with the special text "Printing date" will always be updated. In the special "Numeric scale" type boxes, the number of decimal figures shown becomes sensitive to the scale, so that some decimal figures are hidden if they imply differences in the measurement lowers than 0.1 mm. This avoids seeing, for example, Scale 1:52384.37, when it is not necessary to show the decimal figures. Even so, you continue to have control of the exact value of the scale through the "Map" button. In addition, in the text boxes you can define a distance between the reference frame of the boxs and the text. -Text file (TXT) or metafile (EMF, WMF): In the first case, it allows you to introduce a plain text read by MiraMon from a text file (TXT format) that you specify. In the second case, it allows you to introduce a Windows metafile; files of this type may contain raster or vector drawings (bitmaps); art texts, graphics texts, etc. They can be generated by several graphic design applications such as CorelDraw or MiraMon itself. Fore more information, consult emf/wmf/bmp/jpg. Files of the Windows Metafile (WMF extension) and Enhanced Windows Metafile (EMF extension) types can be not only incorporated but also generated by MiraMon for its own use as well as for use by graphic design programs. It is important to note here that metafiles can be "transparent", a feature which makes them ideally suited for superimposing a picture onto a map, for generating reference compositions where the map can be printed, etc. As far as metafiles are concerned, keep the following considerations in mind: - Miramon will print them as large as possible within the space provided in the box assigned. If the option "Keep metafile XY aspect ratio" is activated, MiraMon will print them without any deformities, i.e. without altering their original X/Y relationship. Otherwise, it will adapt them to the shape of the box. Proportions should be kept when the metafile is a logo, a photography, etc. In contrast, if the metafile is a symbol such as an arrow, the possibility to deform it makes it easier to reuse and increases the capacity for graphic expression through the printed page. - If you generate metafiles in a different application, such as CorelDraw, specify "do not include placeable header" when exporting them. If you do otherwise, Windows will be unable to interpret them. If you generate enhanced metafiles, do not replace their EMF extension by WMF as this would mislead the system: Windows 3.x metafiles must have WMF extension and cannot have names longer than eight characters (not even under Windows 9x or NT). Enhanced Windows 9x and NT 4.x metafiles must have EMF extension and can have names longer than eight characters. Furthermore, remember that if you define white rectangles, circles, etc., they will cover elements under them. To avoid it, define them as transparent. - If you do not indicate extension, MiraMon will assume that it is an EMF file. -Location map: Allows you to have a reduced view of a more general map, where a rectangle of configurable thickness and color indicates the area that is seen on the printed map. The location map can be the general view of the map we are working on or a different MMM or MMZ, even in another geographic reference system. The box can be opaque if you wish, and you can indicate any background color. You can choose the face, size, color etc of the fonts of a text box (own text or user text) with the "Font" button. In addition, from the box of properties of the boxes you can edit the name assigned to each box with the "Name" button. In order to access a box drawn on the print preview, double-click on it or click with the right mouse button and select "Properties". To access a box, you can also double-click on it once you draw it on the print preview or by right-clicking and selecting "Properties". When a box has very small dimensions at the zoom level at which we are working on the print design at that time, interacting with it with the mouse only allows you to move it. If what you want is to resize it, increase the zoom enough so that the program can differentiate whether you are acting on the edge of the box to resize it or on its central body to drag it. Remember that if you have made any unwanted movement or resizing, you can undo it with the undo button or with "Ctrl+Z". Boxes allow enormous flexibility when composing maps: you may add logos, situation maps, graphics, complementary explanations, etc. If you let your imagination fly and experience its possibilities "hands on" you will discover that you can attain highly professional performance printing cartographic sheets from your computer while maintaining a precise control of the output metrics. Two further possibilities are: - Reuse MiraMon Maps as illustrating elements in other maps: generate a situation map in MiraMon, print it onto an EMF or WMF file and incorporate it as a box anywhere on your final composition page. - Group various graphic design metafiles into a single metafile adapted to the entire output page, and incorporate it to MiraMon specifying the entire output page as the box's reference frame.
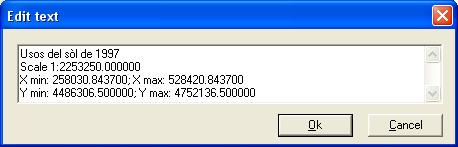 If you edit this text or simply press "OK", the current text will become the map caption. The Edit text box allows normal clipboard operations: copy (Ctrl+C or Ctrl+Ins), cut (Ctrl+ X or Shift+Del) and paste (Ctrl+V or Shift+Ins), but its font cannot be controlled (10-point Arial is invariably used). If you need a text whose font you can control, use a box.
The printing parameters used by MiraMon the first time you access this menu (the printer model, the page orientation, etc) are the automatic characteristics of the Windows printer (formed through the Control Board). When adapting a composition to a new printer, if the size of the paper has not changed (for example it is an oblong A4 in the two printers), the adaptation moves slightly the margins of the elements that could be outside the printable area only slightly because of the fact that the second printer has larger printing margins, but does not change the scale of the map or the size of the objects (unless an object occupies all the printable area, in which case it needs to be smaller to be able to print it). However, if you modify the size or the orientation of the paper of the printer, MiraMon offers the possibility or resizing the composition considering the position and size of the printable area in both papers (origin and destiny) so that this resizing does not imply leaving any element outside the printable area of the new paper. This option includes the position and size of the map, the legend and boxes, thicknesses of the boxes, sizes of fonts, etc. The only element that is preferable not to resize is the thickness of the lines of the reference grid (if you have them selected as visible). Note: Remember that if you do not have a printer physically accessible at your present location (for example you are designing the printing to plot it externally), you can configure, from the Windows control board, the driver as if you had it, specifying "FILE (Print to a file)" as the port. When you send the map that you are loading to be printed (when you press the button "Print"), the name of the file that stores the document will be requested (and it is saved in a format that can be read by the printer but not by MiraMon). If you do not specify route (that is to say, if you only indicate the name of the file that stores the document), this file is saved in the same directory as the file that you have loaded. If you have more than on file loaded, and these are from different directories, the file that stores the document to print is saved in the directory of the last layer opened in MiraMon. It is also useful to send a file to print to make BATCH processes of massive printings. Fore more information about mass printing, consult the section Printing from Command line parameters.
If your computer does not have enough resources, it is possible that very complex maps cannot be copied into the clipboard. In these cases, you must create an EMF and import it from the destiny application.
EMF files are much better than WMF, that is the reason we recommend them. Even when the destination program has the "Special paste" capability, generating EMF is still useful because very large maps could not be passed through the clipboard due to Windows limitations. If you save the file as BMP, MiraMon allows you to change the resolution and/or the number of columns and rows (interesting also for generating BMP that will finish being a JPG or a GIF in a HTML page). The generated BMP is always 24 bits of color (you can degrade it if you would like). However, keep in mind that not all the printer drivers allow this resolution. The icon "Permute R and B colors" allows you to interchange red (R) and blue (B) in some drivers that invert these colors. MiraMon activates this option if the driver needs it, but if you see that the red and blue colors are interchanged (only the green ones are correct), change the activation of the option. Supposing that you choose JPG, MiraMon in addition to this, allows you to activate "progressive JPEG" icon (gradually drawn, useful if it is for the Internet) and to choose the quality of the resulting image. It is possible to use a whole value between 1 (minimum size of the file with total degradation of the image) and 100 (maximum fidelity to the original one but a larger file); the value is automatically 75. In addition, when printing BMP/JPEG MiraMon remembers the parameters of the previous execution in the same MiraMon session. 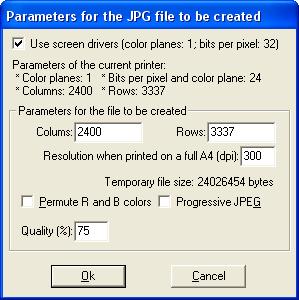 The number of columns must be a multiple of 8 due to Windows internal causes; MiraMon already considers this, and it adapts it properly. The button "Use screen drivers" allows you to use screen drivers instead of printer drivers to generate BMP or JPEG. This is useful when you have not installed color printer (but remember that you can always configure one although you do not have it physically available. For more information, consult Printer), or if the drivers of your color printer gives you problems. However, usually you will be able to generate higher quality files (more resolution but also more larger) with printer drivers.
In addition, the print design box automatically redraws when necessary. However, a button has been incorporated that allows you to disable this option so that in very complex map compositions or on slow computers or networks it may be preferable to work in the previous mode, which only redraws on request (by pressing F5 or the corresponding button, located at the top of the box).
-Show printable area, ambit of the elements, detailed map, etc: Show printable area: This allows you to draw the printable area inside the field of the selected paper. The boundary of the printable area is drawn with a pink rectangle. Show ambit of the elements: This allows you to visualize the limits of the elements of the previsualization if you have not defined a frame thickness for each of them. The boundary of the element field is drawn with a sky blue rectangle. Show detailed map or detailed boxes: This allows you to avoid redrawing the map or the boxes, drawing a frame in its place. However, this action only works if you have the button "Map..." or "Boxes..." activated. -Grid: This allows you to overlap a reference grid for the design, as well as fit the objects automatically if you would like to. Snapping the objects in the grid is made according to a criterion of proximity of the sides of the object to the next line of the grid. When moving an object with the activated snapping function, if the top side is closer to a line of the grid than the bottom side, the object will be snapped to the top side. Similarly, if the left side of the object is closer to a line of the grid than the right one, the object will be snapped to its left side. Since horizontal and vertical snapping is simultaneous, taking into account what we have explained, the object will be snapped to the left top vertex to a grid crossing. Naturally it is not possible to be snapped to the other two sides (lower and right) unless the width and the height of the object are multiple of the spaced of the grid. Important: snapping has less priority than aligning or centring elements with the right mouse button (consult Interactive edition of the composition elements. That is to say, although you have activated the option of snapping elements, if you request for example "to align the top part of the legend with the top part of the map", snapping does not apply, but it will move the legend to align it as requested. By using the button "Configure..." the grid spacing can be modified (in paper units). -Use map reference frame: This allows you to define a reference frame in which the map is fitted. If the square is disabled, the map reference frame agrees with the map face. However if the box is activated, this allows you to visualize the map reference frame defined in the "Map printing parameters". This function is useful for designing cartographic series, when a reference frame of the same size is always desired (independently of the area that the map needs) and the map is centred within this frame, but it is not recommended in general use.
In the case of resizing the map and if the map reference frame agrees with the map face, MiraMon allows you to change the scale (maintaining the field) or change the display field (maintaining the scale). However, the resizing cannot be made if the map reference frame is different form the map face. In the case of resizing a text box or the legend, the font can also be resized, keeping the width of the font or resizing it. In addition, the printing design box has fast keys as the main screen of MiraMon (like F1 for the help, "+" and "-" for Zoom, F5 to redraw, "Supr" or "Del" to erase, etc). 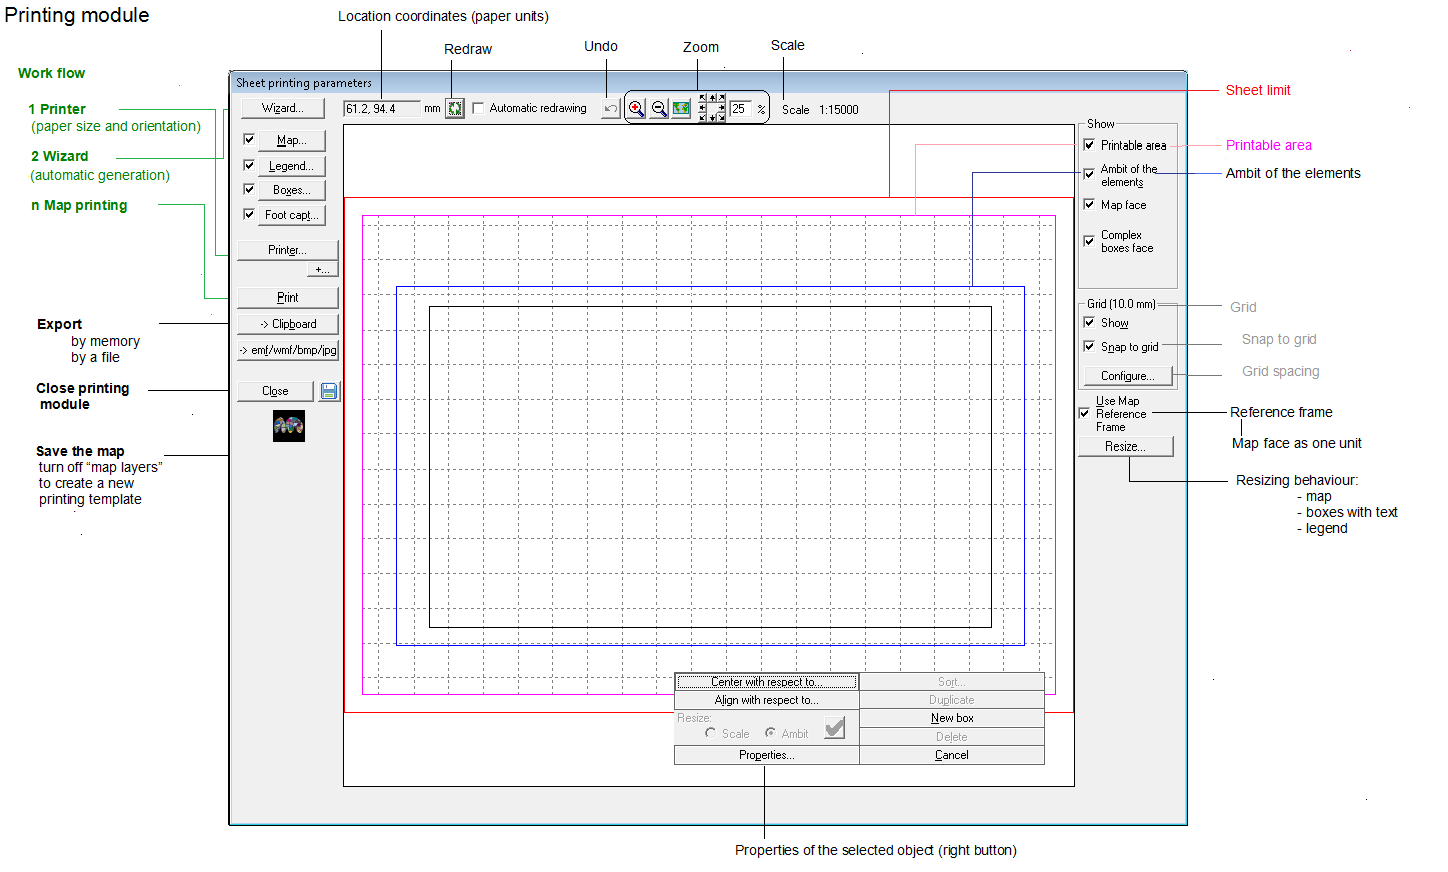 MiraMon allows several options in the interactive edition of the composition elements. In all cases, it is necessary to select the element to be modified (with a dark blue frame). In order to select an element, you have to click on it with the left mouse button. Once the element has been selected, you can modify it interactively. Interactive editing of composition elements: Once you have obtained a result by running the print wizard or editing each of the parameters, MiraMon allows you to modify those you consider appropriate.
In addition, by clicking the right mouse button on the map, the following contextual menu appears, which allows you to make several options as described: 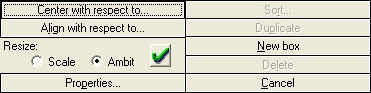 If the element on which you click the right mouse button is not the map, the contextual menu that appears is similar to the previous one, although the option "Resize" changes by "Font": 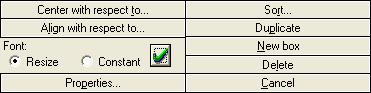
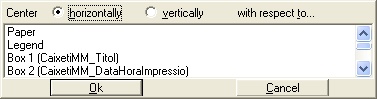
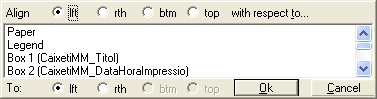
|
|||||||||||||||||||||||||||||||||||||||||||||||||||||||||||||||||||||||||||||||||||||||||||||||||||||||||||||||||||||||
 allows access to the favorites box from the button bar. It is possible to open more than one map at once by clicking on the links, whether it is a map of local collections such as HTML pages or remotes MMZ. It also provides HTML pages that collect most of the thematic cartography available. For more information consult the
  and, if desired, is is also possible to save this configuration in MiraMon.par through the "Save" button. It is possible to have more than one directory of favorite collections, so that, for example, all users of an organization can view certain collections, that users of a group can also see other collections, and even that individual users have access to more collections (by defining in MiraMon.par CollecDir1=, CollecDir2=, etc.).
 . The new option brings up a list with several fields (name, extension, type, etc) that allows sorting by any of them. A filter has also been incorporated to show only layers of a certain typology.
 , located at the bottom right of the box, the items are no longer wantted to have in sight.

 ) or the raster and vector query cursor (
 ) are necessary. By pressing F9 you can change the cursor mode.
 you will access the box "Show information about:" in which you will be able to choose the information that you wish to show in a query. The default values are defined through the parameter "ParamInfoConsultaLocalitz" of the MiraMon.par file.
 button of this box, you will be able to choose not to show information on the fields that could not have been solved due to the broken connection (default option in MiraMon), or get information about the field that contains a NODATA value, which has caused the broken connection (useful when you purify a base and you do not want to find an empty field but you want to see what is the reason for the lack of data).
 ) the size of the box can be modified, in proportional intervals to the usual resolution of the screen. The key "MidaCaixaConLon=" of the MiraMon.par file allows you to automatically control the desired value. The button "
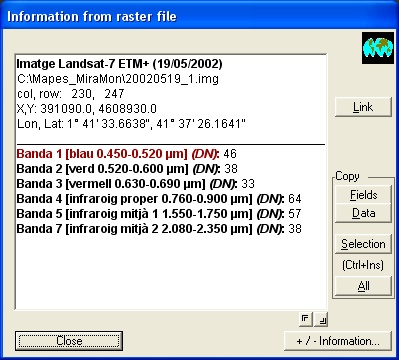
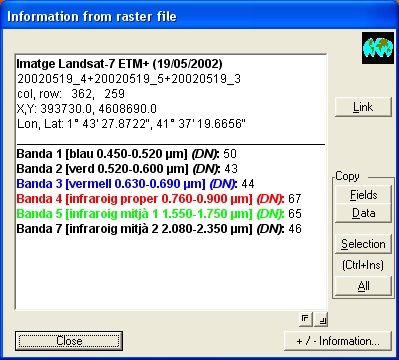
 ) is necessary or the raster and vector query cursor (
 is highlight, allowing any of the registries related to that graphical object to be queried; a typical application of this is storing results of polluting parameters (for example in the atmospheric analysis shown in the previous picture) on the same graphical object (for example a control station). In order to end the query, press the button "Close".
 allows you to look for another graphical object of the same file or other opened files that are within the scope of the selection window of the cursor. For example, imagine that we have two files open, one of municipal limits and one of rivers, and that one of the rivers is the border between two neighbouring polygons: when we click on this scope, the button "Continue searching" will allow us to obtain data successively about the river, about the first neighbouring polygons and about the second neighbouring polygons. There is no limit on the number of objects that we can found. If, in addition to vectors, you also have a raster loaded, and the cursor is of the type
  .
.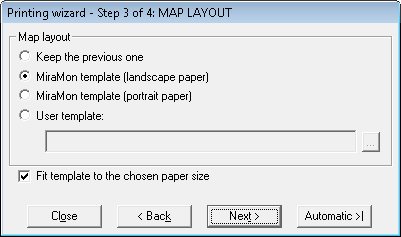
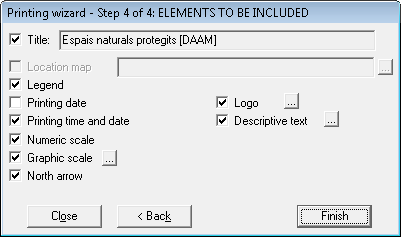

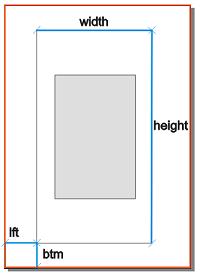
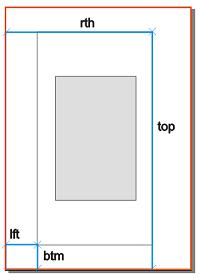
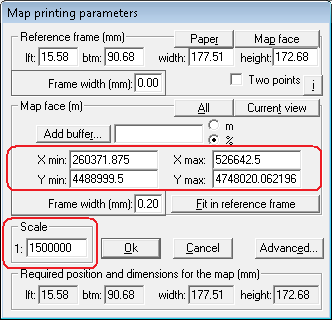
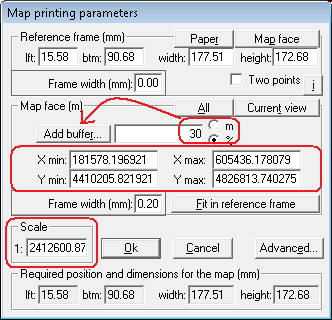
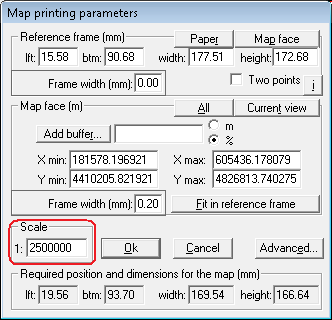
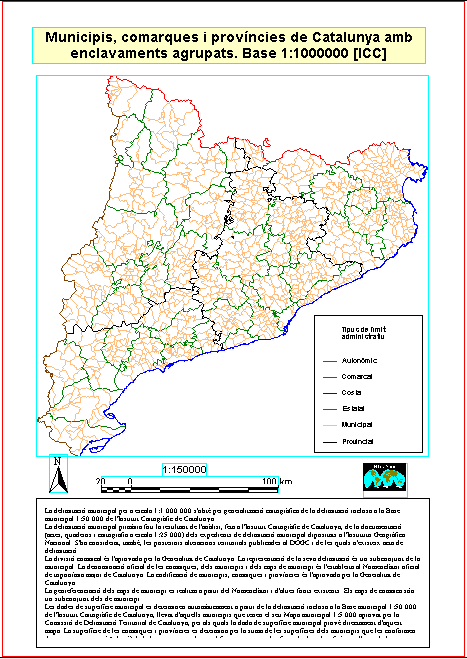
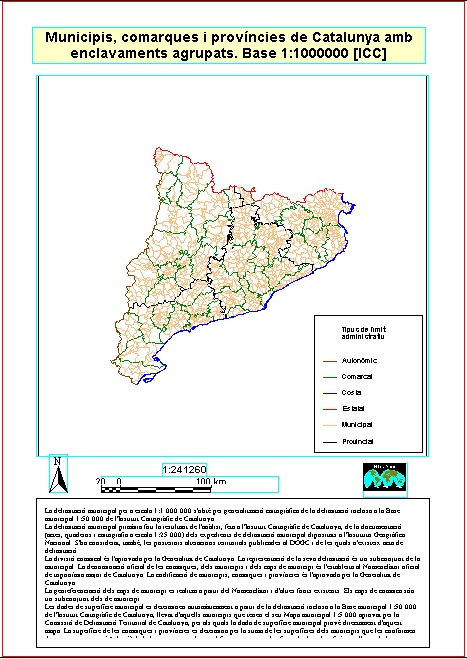
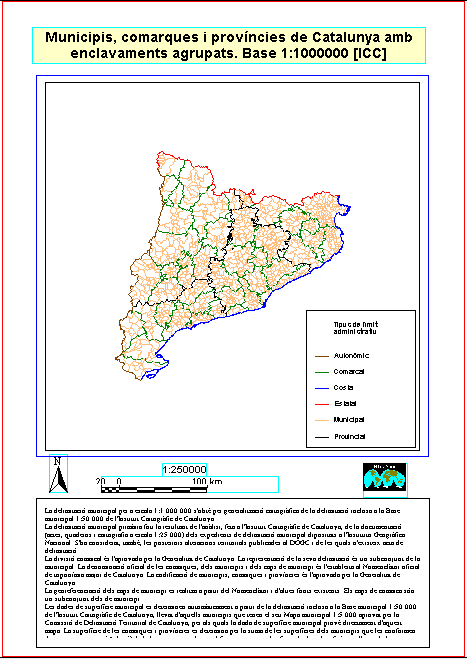
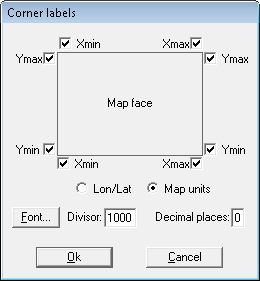
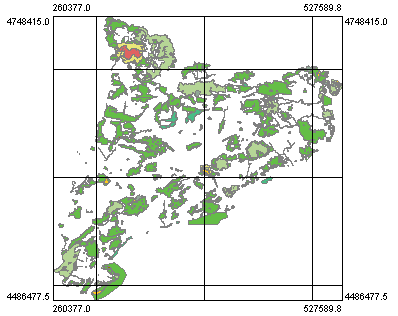
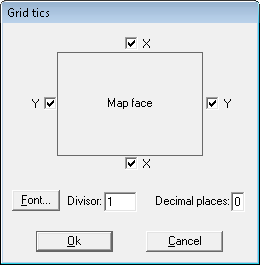

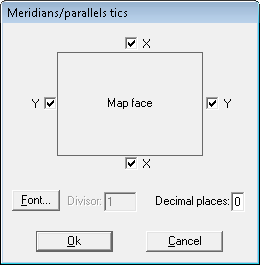
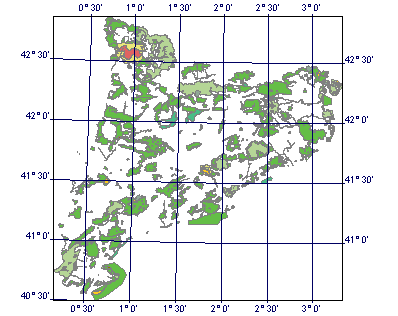
 ) or disabled (
 ), making possible the visualization or not of theses elements and allowing, therefore, to accelerate the printing when you are proving it. The most typical case is to disable the map and to print only the boxes.
 : If you push the button "Legend..." (or if you double click on the legend in a previous view or if you click with the right mouse button and select "Properties") the dialog box Legend printing parameters will appear. This box allows specifying the exact location of the legend; you can set it in paper coordinates (lower left vertex origin) or in map coordinates (in relation to the position ot the map you have set in the "Map" section). The box also allows indicating the font to be used for the legend (size, color, style, etc) and if the legend box should be opaque (and then the background color).
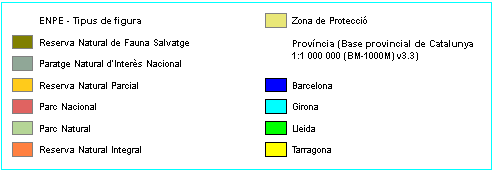
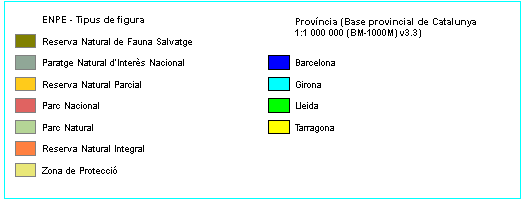


 : This sends the map to the printer or plotter defined automatically or modified previously or to a file (if you do not have the printer available and thus you have defined it in the corresponding driver).
 : If you click on the
  : This allows you to close the dialogue box Sheet printing parameters and come back to the main screen of the session that you have open.
 All the printing parameters (area, scale, boxes, etc.) can be saved in MiraMon Maps (*.MMM). Therefore, if you wish to save the results of your work on the edition of a cartographic sheet, do not forget to save the corresponding MMM file. In addition, you can also save a composition as a template to be used in other compositions. For more information, consult
  : This allows you to visualize the coordinates, in paper units, of any point of the paper on which you place the cursor. This information makes locating the different elements from the printing sheet easier (map, boxes or legend). Notice that the origin (0,0) is in the bottom left corner of the paper.
 : This allows you to load the set of the printing sheet during the design or before sending it to the printer. The physical boundary of the paper is drawn with a red rectangle.
 : This allows you to undo the last action to move or to resize an element of the printing composition.
 : The button "Zoom +" allows you to increase the zoom in each pulsation where you click, and the button "Zoom -" reduces it. The button "General view" allows you to return to the general view. If you press the right mouse button you will cancel the zoom functionality and you will return to the interactive edition of the composition elements.
 : The direction buttons allow you to move laterally once you have fixed a certain level of zoom that is different from the general view. The percentage of displacement when moving can be changed through the square located next to the buttons.
 : In order to move an element you have to put the cursor (an open hand) over the selected element. If you click with the left mouse button, the hand closes, then you can move the chosen element to the new location.
 .
.