|
Information menu |
Get raster/vector informationThis allows either a query by location of rasters and vectors, only loaded rasters or only loaded vectors. The cursor changes in appearance to indicate which query mode it is in. Pressing the F9 key has the same effect.
For information about the result of the raster and vector query by location, go to Raster query and Vector query.
Pre-info box (vectors)Prior to displaying the complete information about a consulted vector, but after highlighting it, MiraMon can show a little box that allows to "continue searching" or "cancel"; this is useful when many and/or complex vector files are opened. 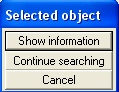 This option can be activated by using the "PreInfoBox" parameter of the MiraMon.par file (it will be the default option), or through the "Pre-Info Box (vectors)" option in the Information menu.
Open database tableThis allows to open a database table of a topologically structured vector file with MiraDades (Visualizer/Editor of MiraMon databases). Another way of doing this is to make a query by location and pressing the button 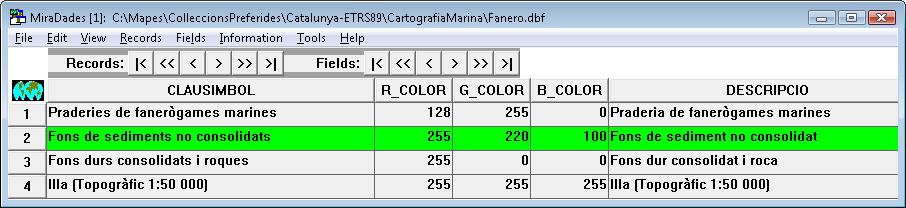
Once the database table is open it is possible to carry out all the possible options with MiraDades.
Query by attributes (where is ...)This allows to query by attribute using any opened file, either raster or vector (structured). For conventional raster files, where each cell contains an attribute value (thematic class, height, slope, radiance, etc.), querying is done on these values. For structured vectors the query is done on a field of any database table. If the database has records not linked to graphic objects (the graphic identifier is a negative value or a number greater than n-1, n is the number of graphic objects in the file), these records are ignored. In polygon databases, the polygon 0 (the universal polygon) cannot be consulted. 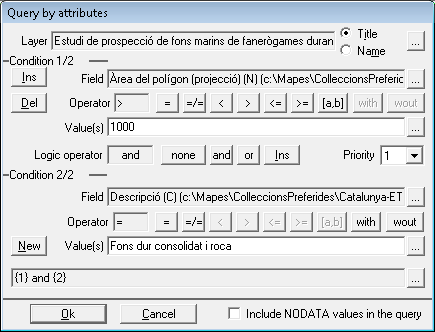 The query is done by first choosing the graphic file to consult, which can be visualized by Title or Name. Second, the condition is chosen, choosing the field in which the query is to be made (if fields come from different associated tables, all the fields appear in a list and the table to which the field belongs is indicated in brackets), the operator to apply and the values to query. The possible operations are:  "Equal to", "different to", "lower than", "higher than", "lower or equal to", "higher or equal to", "between two values", "with" and "without" (respectively). The operators "with" and "without" apply to character chains, for example, it is possible to search for all the cities with "Hill" in the name. MiraMon allows to make queries with an unlimited number of conditions, and therefore very sophisticated expressions can be used very sophisticated sentences. To introduce new conditions, the desired logical operator is pressed and the options of the second condition will be activated. To introduce a condition before the first one, the corresponding key should be pressed "Ins". The new condition will be the first and the one that was previously defined will become the second condition. To introduce a third condition, press the button "New". A system of priorities means the user do not need to worry about unbalanced parentheses when there is more than two conditions. Suppose there are 3 conditions with the following operators: 1 or 2 and 3 Suppose that the query is carried out in a forest inventory, in which the first condition is that the species is "Pinus halepensis", the second condition is that the species is "Pinus pinea" and the third condition is that the percentage of cover is higher than 75%. If first priority is given to the first two conditions, the query is carried out in the following way: (1 or 2) and 3 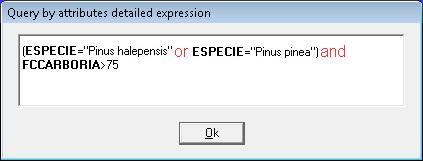 Therefore, the points of the inventorywhere there are "Pinus halepensis" or "Pinus pinea" are selected, and that, independent of the specie, have a cover higher than 75%. However, if first priority is given to the second and third conditions (therefore, between the first and second condition there is second priority), the query is carried out in the following way: 1 or (2 and 3) 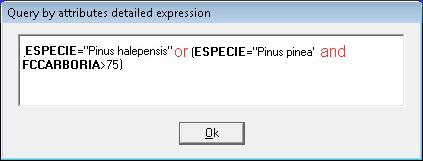 Therefore, all the points of the inventory where there are "Pinus halepensis" (with any percentage of cover) and the points of the inventory where there are "Pinus pinea" with a cover higher than 75% will be selected. The summary of the query is continually shown in the lower part of the queries by attribute box. The button of the three points located next to this summary box allows to see the detailed expression of the query with enriched text. In a query with 5 conditions and the following priorities, the parenthesis system would be: Conditions and operators: 1 or 2 and 3 or 4 and 5 Priorities: 1 3 2 4 Results of the query: [(1 or 2) and (3 or 4)] and 5 Once the query is launched, MiraMon looks for the matching records in the raster files or databases, depending on the target file selected. If some entries are found, they are shown with the color indicated in "View | Selection color". A box also appears a box ("Query by attribute results") where it is possible to check how many cells or pixels (raster) or graphic objects (vectors) have been found, how many database records have been found (vectors) (it should be noted that MiraMon supports a single graphic object linked to several database records: for example different observation dates on the same point) and how many elements are visible in the current view. For raster files, when zoom is <1 the number of visible cells is only approximate. In the "Query by attribute results" box the following actions are available: 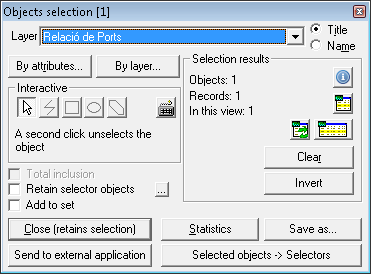
Selection by clic Selection by transect Selection by rectangle/square Selection by ellipse/circle Selection by irregular polygon 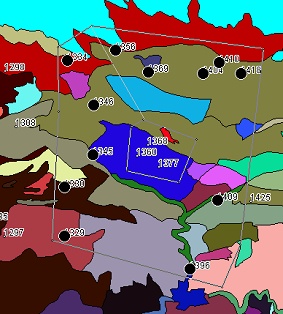 Selection by coordinate entry via keyboard The box "Add to set" governs whether the selected objects are to be accumulated the selected objects, either interactively or by attributes. After any query by attribute, the Zoom menu allows to zoom to the selected objects, using the button "Zoom to selection" (
Selection: cancel, statistics, exportThis allows direct access to the "Query by attribute results" box (cf. Query by attributes (where is ...) for more information) if the option "Close (keep selection)". This:
A quick way of accessing the query by attribute box is with the icon
Measure distance, perimeter, areaThis allows to calculate the distance between two points, either in one segment or in various segments. For the latter, MiraMon allows to find out the total length and the length of the last segment in map units. 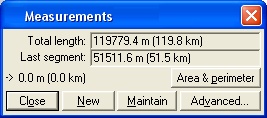 To obtain the area and the perimeter of a polygon, the corresponding key should be pressed the corresponding button. MiraMon will close the polygon automatically joining the first and last marked vertex, and calculate the corresponding Area and Perimeter. The button "New" allows to start a new distance measurement. The button "Keep" allows one to return to the client window, keeping the segments used in the previous distance measurement. The button "Advanced" in the "Measurements" dialog box allows to carry out the query in a temporary file, save it in a permanent file or erase it. If the query is saved the query in a temporary file, when the user close the MiraMon session a message will appear asking whether the measurement is to be saved the measurement in a file. 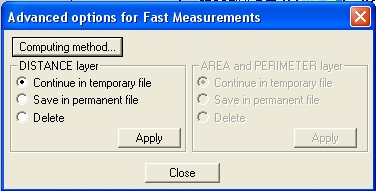 The button "Computing method" in the "Advanced options of fast measurements" dialog box allows to calculate the lengths, perimeters and areas on the cartographic projection or on the reference ellipsoid. MiraMon automatically applies the geodesic calculation (on the ellipsoid). 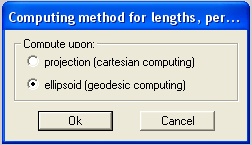 A quick way of accessing the query by attribute box is with the icon
Crear annotationsAllows annotations into one map by inserting dots (with or without anchored text), lines or polygons, which are modifiable, eliminable and they can save on maps. This annotation tool is accessible from the toolbar via the button Point type annotations carry an associated symbol as well as an anchor text. To choose symbol size is allowed (in screen pixels) and the source of the text. There are three default symbols (circumference, cross and balloon) and another symbol can be chosen through the button 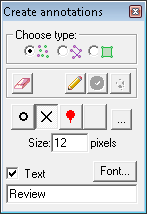 In line type annotations it is possible to choose the color and thickness of the line. There are three colors and thicknesses by default and others can be chosen through the button 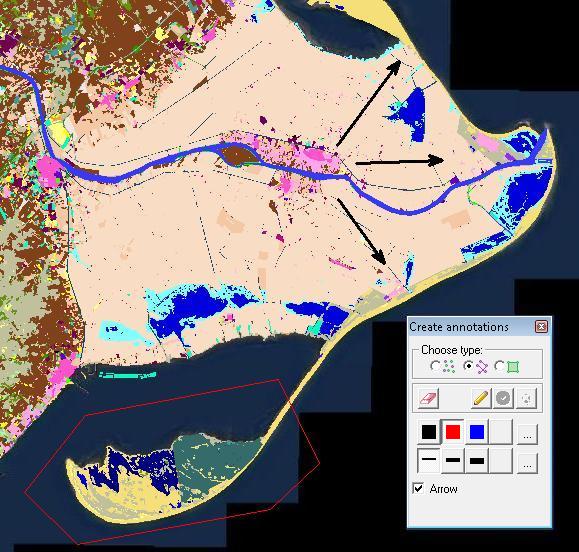
Polygon type annotations allows the user to choose the color and transparency degree of polygons. There are three colors and transparencies by default and others that can be chosen via the button 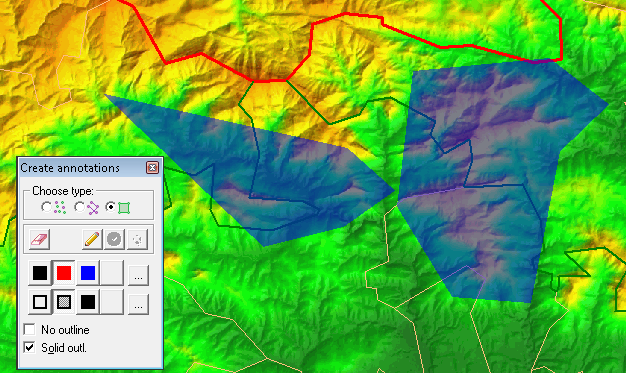 Annotations can be modified or delete once they have been created. To do this access is required to the Delete/Modify annotations button in the same window as annotations. 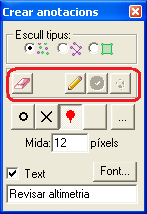 To delete an annotation it is necessary to press the button with the delete icon ( 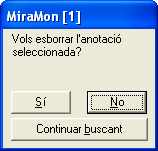 To modify an annotation it is necessary to press the button with the modify icon
ANSI/OEM character setThis allows to work with the character sets of the plain text files and the database files with the ANSI 1252 set (used mainly in Europe and in the entire American continent) or the OEM-850 set (used approximately in the same geographic area). ANSI/OEM character set in plain text files: MiraMon assumes that plain text files (TXT, REL, DVC, etc) using the same text editor: a Windows editor using the ANSI 1252 set or a DOS editor using the OEM-850 set. Therefore, the program can be configured the program to interpret texts according to some of these character sets: "Treat text fields as Windows ANSI" or "Treat text fields as DOS OEM-850". If accented characters are not displayed properly (either in titles, legend, queries, etc), the ANSI/OEM criterion can be inverted the ANSI/OEM criterion with |Information | ANSI/OEM Character set | and this will probably solve the problem. The MiraMon default for this criterion can be established using the parameter "JocCaracTXTPerDefecte" in the MiraMon.par file. 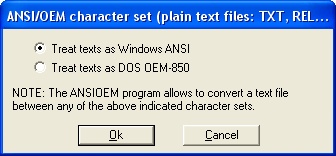 If ANSI and OEM files are mixed, a good idea would be to join them to one of the two sets by translating the files from the system that is considered to be less convenient (ANSI or OEM) into the desired one (ANSI or OEM). For permanent conversion, the ANSIOEM program, shipped with MiraMon (or its Windows interface, accessible through "Tools | File maintenance"). OEM texts can be edited using the DOS "EDIT" and ANSI texts can be edited using the Windows "NOTEPAD". ANSI/OEM character set in database files (DBF): Many DBF tables generated by modern programs have an internal mark indicating which character set is used. If this set is supported by MiraMon (most European and American languages) the right conversion is automatic and the table is always properly displayed. Nevertheless, all tables can also be translated to an internally coherent character set by using the ANSIOEM program. However, this is not necessary for display purposes because MiraMon and MiraDades do the necessary conversions. ANSIOEM is accessible through "Tools | File maintenance". However, if the table has been generated using less modern software (such as dBASE III+), this mark may be missing (set=0) and the table is usually in the OEM-850 character set; if the table has been translated directly from some other software, it may also not be marked and is usually written in ANSI 1252 if it comes from a Windows software. In these cases, it is possible to switch from one system to the other to see which is the correct one (if any); once it is clear, mark the table to the appropriate type using the ANSIOEM program. After the table has been marked using a set recognized by MiraMon, it will be automatically displayed with the appropriate conversion. As mentioned before, tables can always be translated in order to join them internally to the same character set. MiraDades reports the character set in the header of each DBF table. To access this information, the DBF table is opened (| Information | Open database table), and press "Information" button.  The "JocCaracDBFPerDefecte" parameter from the MiraMon.par file allows to establish which conversion MiraMon applies to the non-marked tables (set=0) or to the tables marked with a set that is not known by MiraMon.
Show coordinates and colorsThis turns a dialog box showing information about the central point of the cursor or on off. This information includes the coordinate [columns, rows] (only raster maps) and [X, Y] and [longitude, latitude] (raster and vector maps) and also the RGB values of the pixel's color on screen and the index in the color symbolization table that is currently active (shown in brackets). When there is no color palette loaded, or when there are only palettes associated with vectors, a dash [-] will be shown at the index position. A pixel's RGB value is shown as P25 palette indices. [longitude, latitude] coordinates only appear if the reference system is known by MiraMon. The type of coordinates to be displayed can be set with "Information | Advanced options".  The initial position and dimensions of the coordinates box can be defined through the "AmpleCaixaCoord" parameters of the MiraMon.par file. The window can be resized (useful when the coordinates fill a lot of figures or when screen space is to be saved) and it can be located where it is most useful. It should be taken into account that the drawing scrolls may become slower if it is placed inside the map area. This is because drawing scrolls have to "skip" the obstacle. The amount of coordinate figures [X, Y] is determined by the "MostrarCoordenades" parameter of the MiraMon.par file or through "Information | Advanced options". As displaying coordinates continuously can affect multitask processes negatively (the computer works slower), when background programs are executed, it is better to close the coordinates display while it is not needed. Moreover, if the CPU is not very fast, cursor redrawing (when moving it) is finer when coordinate display is turned off. This window can also be turned on and off by pressing the F6 key.
WARNING: When a raster map is displayed, the index of the color palette is only the same as the value in the file if the map is bit, byte or byte-RLE and a graphics card is available that can show at least 32768 simultaneous colors. On 256-color graphic boards there may be some changes, in a maximum of 20 of the 256 colors. Examples: 1/ Regardless of the graphic board, to determine the value of a cell in an integer file the query is performed using the left mouse button, so that the value is read on the file, and not on the graphic board. 2/ If the graphics card can only display 256 colors simultaneously and a byte file that shows pixels with all values, there will be some colors (20 at the most) represented with a palette index that may be different from the file value. This is because Windows reserves some colors for the title bars and other parts of the display: if 256 colors are required and some of them are not the ones preserved by Windows, it means that more than the 256 colors supported by the system; Windows adapts (scans) the "excess" colors to a similar color of the 256 ones that it can load; when displaying images with a grey palette this means that some greys are seen as pale yellows.
Show legendThis turns a floating window showing the title and the legend of the raster map being displayed on and off. To save space on the screen, only 16 categories are shown, but if the legend has more than 16 classes, the
Modify layer order and propertiesAllows the order (vertical) of the layers or groups of layers shown. It also allows to change their properties (visible, consultable, copiable when digitizing, etc). For more information, see Modify layer order and properties in view menu.
Legend defaultsThis allows to show the color visualization in the legend as the color indices of the categories or as the indices of the links with categories, when the layer does not have the visualization conditions in the legend defined in the REL file or the MMM.
Show GPS trackThe GPSMM module that is available in the menu "Tools | GPSMM" allows to take data from a GPS connected to the computer (usually a laptop) and generate a PNT or a screen dump. Using the option "Show GPS tracking" GPS data can be viewed in real time in the MiraMon window and follow up of selected objects (either by attributes or interactively) that change the position in space ("map moving") or its attributes. This typically allows track objects from a base updating, either in position or content (e.g. see the position of fire engines that are acting in a fire) and of which the position is updated periodically. At the same time too the various types can also be managed the various types of regular refreshment and follow-up of layers (including that of GPS). Finally, it is also possible that the layers with periodic refresh maintain their selection of objects in case it exists.
GPS tracking parametersWhen data are being captured from a GPS connected to the computer it is possible to define the percentage of the screen that the user don't need re-centered. With a value of 0%, each new point that is captured will be re-centered. With a value of 100% the new point is only re-centered when it goes off the screen. The value is automatically 80%. It is also possible to define the radius of the GPS tracking zone, that is the radius of the circle drawn on the edge of the arc of the path when tracking with the GPS in real time, which can be defined in pixels or in map units. 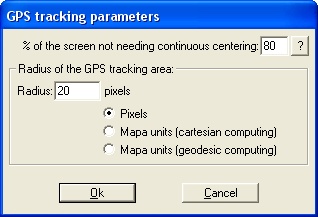
Current reference systemAllows access to the information about the parameters of the reference system used in the files which are currently active.  Information is given about the following parameters: the identifier of the reference system (with the description and its units), the cartographic projection (identifier, description, if dealing with an equivalent projection, equidistant, conform, etc), the projection parameters (zone, hemisphere, Tissot constant, etc), the parameters of the data (identifier, description, application locations, etc) and the parameters of the ellipsoid (identifier, description, type, equatorial radius, etc). Information is also provided, if available, on the datum transformation parameters to WGS84 and EPSG synonyms. The content can be copied to the clipboard with the "Copy" button, located at the bottom right of the box.
For more information, see MiraMon horizontal reference systems.
Opened mapsThis lists the MiraMon Maps (*.MMM) that are currently loaded and their titles. 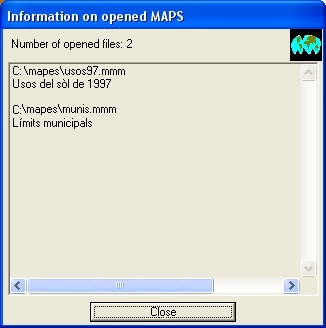
Opened rastersThis gives the essential characteristics of the currently opened rasters that are being displayed through the "File | Opened raster" option as well as the ones the system are displaying through "File | Opened map". Among other characteristics, information is given on the database distributor, the title, the file type, the number of columns, the raster limits, etc. From the information window on opened rasters their metadata can be accessed. 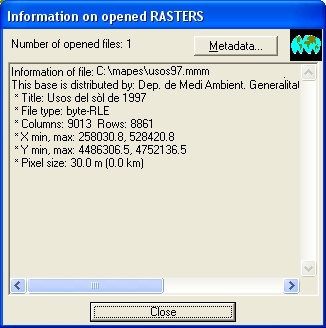
Opened WMS/WMTS layersThis gives the essential characteristics of the WMS layers currently open. This provides information about the source of the WMS layer, the title, the format, and other factors. 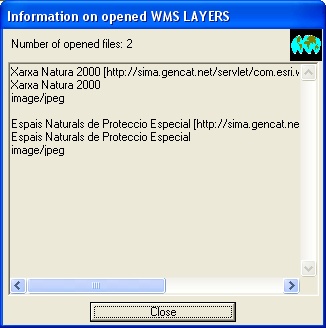
Opened vectorsThis gives the essential characteristics of the currently opened rasters that are being displayed through the "File | Open vector..." option as well as the ones the system are displaying through "Edit | Digitize/Edit vector" or through "File | Open map". It also gives information about the type of graphic object of each file and about the characteristics selected for its display (color, text, etc.). 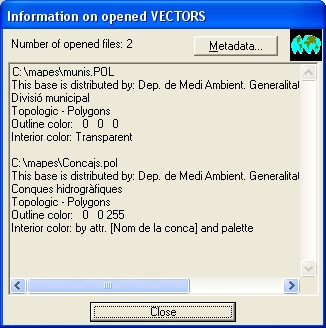
Opened seriesIt gives the essential features of the currently open cartographic series. Among other features, the number of open series, the identifier of each series, the title, the number of open sheets in each series, etc. are reported.
Opened palettes and symbolization tablesThis gives the name and the number of colors of the currently loaded palettes. If these palettes have been resized to adapt them to the raster or vectors, the number of colors will be equal to the new number. If a palette has been changed using the color editor or due to image enhancement processes, MiraMon will also indicate this. 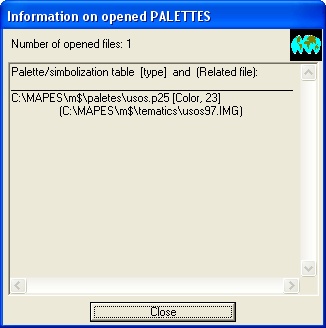
Advanced optionsThis allows to define some of the parameters shown in the information about the layers, such as the number of decimal figures of the coordinates, the reference system units, the format of the longitude-latitude coordinates, the number of decimal figures in queries and statistics, etc. 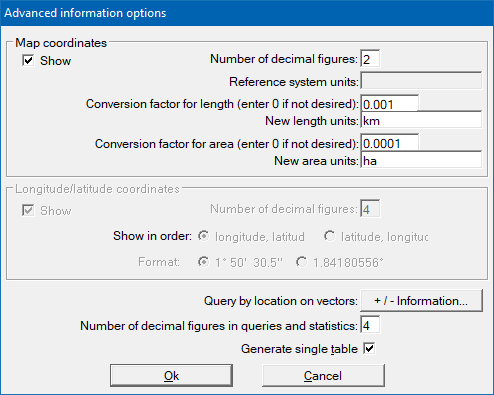
|


 Open single table with selected records or the button
  Open main table with selected records.
 : Allows objects to be selected simply by clicking on them with the cursor. The objects are select whether they are partially or completely within the circle which will appear at the cursor tip. A second click deselect the object.
 : Lets trace (digitize) a line that selects all objects that touch. Each click sets one of the vertices of the line or transects; by pressing the Backspace key the entered vertices can be undone the vertices introduced if they are unsatisfactory. Once done a minimum of 2 vertices the line can be finished the line by pressing the right button of the mouse.
  : Lets trace (digitize) a rectangle that selects all objects which contains (the "Total inclusion" button governs whether the objects should be entirely within the rectangle, or not, to be selected). The first click establishes one of the vertices of the rectangle, while the second click sets the opposite vertex (F3 can also be used F3 for a geometric connection of this second vertex or finish the figure by right-clicking). During the process of drawing the rectangle appear in the box the dimensions X,Y (sides) in map units. If the uppercase key is held down, a square is drawn instead of a rectangle. To create squares of one size constant, the "Constant side" button is activated and the desired side is entered in the appropriate box; in this case the first click sets the top vertex left of the square and no second click is needed.
 : Lets trace (digitize) an ellipse, centered at the location of the first click, which selects all objects it contains (the "Total inclusion" button allows one to control whether the objects must be entirely inside the ellipse, or no, to be selected). The first click sets the center of the ellipse, while the second click sets the other two radius (F3 can also be used F3 for one geometric connection of this second vertex or end the figure by pressing the right mouse button). During the process of the dimensions of the ellipse appear on the box X,Y (radius) in map units. If the uppercase key is held down, a circle is drawn instead of an ellipse. To create circles of a constant size, the "Constant radius" button and indicate, at the corresponding box, the desired radius; in this case the first click sets the center of the circle and there is no need to make a second click.
 : Lets trace (digitize) an irregular polygon that selects all objects it contains (the "Total inclusion" button allows one to control whether objects should be entirely inside the polygon, or not, to be selected). Each click sets one of the vertices of the polygon; by pressing the backspace key the entered vertices can be undone the entered vertices if they are unsatisfactory. Once the user have made a minimum of 3 vertices the polygon can be closed by right-clicking. The polygon can be convex if appropriate. On the other hand, if the lines are crossed of the edge of the polygon with each other during the tracing (for example if draw a five-pointed star), MiraMon will apply a criterion of inclusion of alternation inside-outside (in the 5-pointed star, the objects in the inner pentagon are not considered "within" the star); that allows, thanks to tracing a connecting strap with a ring interior, generate inner regions of exclusion, as possible see the following figure:
 : Allows objects to be viewed by entering their coordinates via the keyboard. This option allows to enter a XY coordinate or by angle and distance and continue with the keyboard or mouse. The "Select all... " button is available when there is no object selected and allows, as its text indicates, to select all objects (equivalent to an interactive selection with a polygon that encompasses everything, or to a query by attribute like see ID_GRAFIC>=0). The "Invert" is available when an object is already selected, and allows make the "negative" of the selection, that is, select everything the system do not have selected and deselect what the system had selected. It is useful, for example, if it is desired to select all plots in a cadaster except one: that object is selected and the selection is then inverted. Note: Selection reversal acts at level of objects, not of database records: the selected objects will contain all records, and the deselected will be entirely, regardless of the number of associated records that have been selected for an attribute query. The activable box "Total inclusion ", available when the selector object is of zonal type (ellipse, rectangle or polygon) sets whether the entity is required to be selected either completely inside the selector area, or if only some part is already selected. The button " Clear " cancel the current selection.
 next to the activation button of selectable objects a box like the one in the figure will appear, with 3 groups, one for each type of selection object. In this box only the groups corresponding to those objects that are currently being held will be active (in the example of the figure the system are only retaining the selector points). The 3 first choices of each group are self-explanatory and work as well as the equivalent options in the box that appears pressing the "Advanced" button on the distance, perimeters and areas measuring box. The fourth option,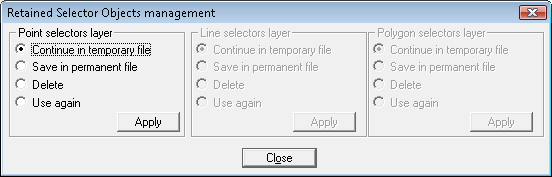
 button)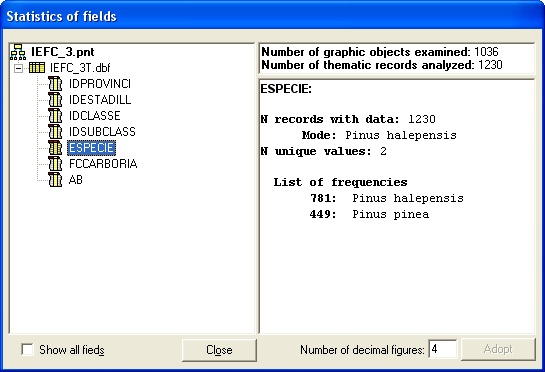
 ).
). in the tool bar.
 in the tool bar.
 or from the menu "Information | Create annotations".
 . It is possible not to represent the symbol by indicating a zero size, so only the text will be seen.
 , choose the annotation to delete and accept or continue searching (in the same area as the click) the annotation to be deleted.
 , choose the annotation to be modified (the box will be updated with the features of the selected annotation), modify the updated features in the window (for example the color to fill in the case of polygons and accept the modification with the icon
  or cancel it with the icon
  .
.
 buttons allow access to them all (this process does not affect the displayed map colors). Note that, also in order to save space, MiraMon does not show the empty classes in the legend: if the 1,2,3 and 255 classes are described in the REL, MiraMon will not show the color box of the 0 class nor the 4-254 classes unless it is otherwise indicated in the "Visualization of the LAYER in the legend" dialog box. If the user use the old DOC files, remember that the empty classes need to have an empty input in the DOC file: "category### : ", including the space after the colon ": "). This window can also be turned on and off with the F11 key. For more information, see