


The African administrative boundaries and populationdatabase was compiled from a large number of heterogeneous sources.The objective was to compile a comprehensive database from existingsources and in a fairly short time period that is suitable forregional or continental scale applications. The resources availabledid not allow for in-country data collection or collaborationwith national census bureaus as was done, for example, in theWALTPS study. With few exceptions, the data sets do not originatefrom the countries themselves, and none of the input boundarydata have been officially checked or endorsed by the nationalstatistical or mapping agencies.
Due to the lack of high quality, published maps showingadministrative boundaries for African countries, this projectmade use of any available data set. For many of the nationalboundary coverages there was no information regarding source mapscale available. If known, the cartographic scale of the sourcemaps are indicated in the country documentation in the appendix.The scales are estimated to vary between 1:250,000 and 1:5 million.
In order to ensure a close match between differentnational coverages, and to obtain maximum compatibility with otherstandard medium resolution data sets, all national boundariesand coastlines were replaced with the political boundaries template(PONET) of the Digital Chart of the World (DCW). The DCW is aset of basic digital GIS data layers with a nominal scale of 1:1million. The use of a very detailed international boundaries templatefor, in some cases, relatively coarse resolution data is somewhatmisleading, but was required to ensure a close match between thenational coverages. In any application the often smaller cartographicscale (i.e., coarser resolution) of the administrative boundarydata in comparison to the international and coastlines templateshould be kept in mind.
For a few countries very detailed boundary data wereavailable for which the spatial referencing information was notknown. In the absence of better data, these were neverthelessincorporated in order to achieve maximum resolution. Yet, thead hoc transformation, projection change and rubbersheeting requiredto make these data compatible with the DCW template have no doubtintroduced positional error which may well reach a magnitude inthe order of 1-2 km.
The population figures attached to the GIS databaserepresent estimated totals for the standardized years 1960, 70,80 and 90. The estimation method and a discussion of data accuracyare the subject of the following section. Data sources vary bycountry. In general we attempted to obtain population data fromeach census that has been carried out at the geographical levelfor which boundary data were available. Where official populationestimates or projections were available from the national statisticaloffice, these were used as well.
Copies of official census publications have beencollected over the past five years from a number of universitylibraries as well as the United Nation's Statistical Library andthe U.S. Library of Congress. Additional material was availablefrom the comprehensive holdings of the International ProgramsCenter's library at the U.S. Census Bureau. Finally, any populationfigures published in yearbooks, gazetteers, area handbooks orother country studies have been used to ensure that populationfigures for as many time periods as possible could be used asthe basis of the estimation.
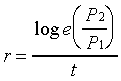
In order to provide an indication of population dynamicsand to maximize comparability across national boundaries, populationestimates were produced for 1960, 70, 80, and 90. This followsthe approach of the WALTPS study which used such figures as thebasis of a detailed demographic and economic analysis of WestAfrica. Since population censuses are not synchronized and censustaking has been irregular in many African countries, figures neededto be interpolated to provide these estimates. For this purpose,province or district specific intercensal growth rates were computedfrom published figures. These growth rates were then used tocompute estimates for the standard years. The intercensal growthrate is calculated as
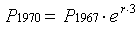
where r is the average annual rate of growth,P1 and P2are the population totals for two different time periods,and t is the number of years between the two enumerations(see, for example, Rogers 1985). The resulting growth rates werethen used to derive estimates for the standard years. For example,based on enumerations in 1967 and 1977 and a corresponding rater, the 1970 population would be calculated as:
In cases where no data were available for a yearbefore 1960 or after 1990, the trend between the two closest enumerationswas used to extrapolate the earliest or latest available data. Similarly, simple trend forecasts beyond 1990 could be made usingthe average growth rates between 1980 and 1990 as reflected inthe figures in the GIS database.
For predictions over only a few years, mathematicaltrend projections are usually fairly accurate, and the specifictype of function used has little influence on the results (Cohen1995). A more elaborate estimation approach such as the cohortsurvival method would result in more reliable estimates, but thedata requirements for this technique (district level age and sexdistribution as well as age specific birth, death and migrationrates for several censuses) were far beyond the scope of thisproject. In fact, it is unlikely that such data could be obtainedfor many countries even with large available resources.
Given the limited amount and quality of the basepopulation data, we checked the resulting total national populationfigures against a standard benchmark, the regularly publishedpopulation estimates produced by the Population Division of theUnited Nations (1994, medium variant). In the summary table inthe appendix, both the total estimated population and the UN figurefor 1995 are presented. Obviously, the UN data are by themselvesassociated with a considerable amount of uncertainty since theestimates are based on conditional forecasts that make a numberof assumptions regarding the most recent and future fertility,mortality and migration rates. They are also based, for the mostpart, on official census figures which sometimes prove to be highlyunreliable (Nigeria being a notorious example). In cases wherethe estimate was considerably different from the UN estimate,the intercensal growth rates were adjusted uniformly such thatthe resulting estimate was equal to or close to the UN estimate.Typically this is the case where data were available only fortwo time periods, or where a country experienced significant short-termchanges in population numbers due to external circumstances. The adjustments are indicated in the specific country documentationbelow.
UN population figures were used in two additionalcases: (1) for countries for which no subnational boundaries ordata were available (e.g., Mauritius and Reunion); (2) for countriesfor which census figures were available for only one point intime, resulting in a uniform adjustment of population figuresacross the nation.
The figures included in the database are directlytaken from the estimation and thus show more significant digitsthan is justified by their accuracy. During data manipulationand processing one should preserve all significant digits, butfor presentation purposes, the figures should be rounded to reflectthe uncertainty of the data. Even the use of population numbersto the nearest thousand would imply a considerable degree of optimismabout the quality of the data.
Given the method used for the population forecasting,the characteristics of the available source data obviously havea significant impact. It is clear that the accuracy is betterfor countries that have had several censuses at regular intervalsover the last four decades. Unfortunately, not all countriesin Africa have had more than two censuses since the 1950s. NineteenAfrican countries did not have a census before 1970, and fourof these had their first census in or after the mid-eighties (U.S.Bureau of the Census, 1995).
The accuracy of censuses obviously varies by country.It was beyond the scope of this project to evaluate the accuracyof every census used, or of any of the official estimates. Thiswould be possible since many censuses are followed by a post-censusenumeration that provides an accuracy estimate. In countrieswith population registers, published population figures are accuratewithin a fraction of a percent. In the United States, censuscounts have been shown to have an accuracy of about 2 percent.With few exceptions, the accuracy of African censuses is likelyto be considerably lower. Detailed discussions of populationestimates in African countries are given in IDP (1988) and NationalResearch Council (1993).
Population estimation is an uncertain science, particularlyin countries that need to rely on often irregular census takingfor population enumeration rather than on a civil registrationsystem. Sources of error are numerous and include
In countries where large and rapid migration movementsoccur, the timing of an enumeration will also have an impact onthe magnitude of estimates for a particular time period. In otherwords, the population estimates can be sensitive to specific circumstancesin the year of the enumeration. An example that was given inthe Asia database documentation that illustrates this point isreproduced in Appendix A1.
A comprehensive discussion of data quality issuesin census taking is presented in the United Nations' Principlesand Recommendations for Population and Housing Censuses (UnitedNations 1980; an update for the 2000 round of censuses is currentlyunder preparation). However, no technical discussion could betterhighlight the uncertainty associated with most published populationfigures (and certainly those included in this database) than thefollowing anecdote: My story about the population of Lagos was thefollowing: The journal West Africapublished a short news item that the population of Lagos was fivemillion. I wrote to them for the source, suspecting that BobMorgan and Ransome Kuti had completed their demographic surveyof the city and had multiplied the inverse of the sampling fractionto obtain its population. But, West Africa wrote backthat one of its correspondents had been told this figure by PegPell (i. Professor Margaret Peil) at the Univerity of Birmingham'sWest African Centre. Thereupon I wrote to Peg who replied tosay that she had been told that figure by Bob Morgan when he wasvisiting Britain. Thus, concluding that my first surmise wascorrect, I wrote to Bob for affirmation and congratulated himon the completion of the survey. He wrote back saying that thesurvey was not complete and forecast correctly that it would neverbe completed, but added the following: "You remember, Jack, that I picked you andPat up at Lagos airport nine months ago. Your flight path hadcome in over the full length of Lagos and you remarked to me thatthe city had grown greatly and now looked as if it might havefive million inhabitants. I knew that you had flown over manycities and knew the populations of many of them, so I thoughtthat this was the best estimate Nigeria was likely to have. Ihave subsequently employed it when people have asked me the question." Given our limited knowledge about the accuracy ofthe input data, it is impossible to make an objective assessmentof data quality. The development of a qualitative index of boundaryand population data quality was considered. However, such anindex would be associated with considerable subjective judgment. Any question "how good are the data?" is incompletesince we also have to ask "for what purpose?" Data that are clearly inappropriate for high resolution applicationsat the province or sub-province level, are still sufficientlyaccurate to be used in regional or continental scale applications(the prime motivation for this project), or for the visualizationof spatial patterns in a country. Thus, we only provide someinformal summary measures in the table below, and refer to theindividual country documentation that provides all known detailsabout the lineage of the data (admittedly, this knowledge is toooften very limited). The user can consider this information tomake his or her own decision about whether the data are appropriatefor the specific tasks. Special care should be taken when thepopulation figures are used as the denominator in the computationof proportions or rates, in particular, when the numerator isvery small as is often the case in epidemiological studies.
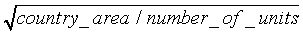
As in the previous databases, we included two usefulsummary measures of data resolution in the summary table in theappendix:
Mean resolution in km=
i.e., the length of a side of an administrative unit,if all units were square. And
Mean population per unit
= total_national_population / number_of_units..
These two measures complement each other. In countrieswhere large areas are uninhabitable, the mean resolution in kmgives a biased impression of available detail. In such cases,the number of people per unit is a more meaningful indicator.
[ Next Section | African Population Distribution Database |
<URL: http://grid2.cr.usgs.gov/globalpop/africa/part1.htm>Boundaries
Population data
I.2. Population projections
anddata quality
Estimation of population figures
 .
.Census data
Additional sources of error
 ,
,
 UNEP/GRID-Sioux Falls ]
Last modified: 19 February 1997.
Please address any comments or suggestions to
 uwe@ncgia.ucsb.edu.