-
 RegLog: Logistic regression
Access this help text as a web page: RegLog
Presentation and options
This application allows generating an explanatory and predictive model of a Y spatial dichotomous variable based on n quantitative Xn independent spatial variables.
The Y dependent variable will be dichotomous and, therefore, the numeric values it will take will be either 1 or 0 (presence/absence, yes/no, success/failure...). The purpose of the analysis is predicting that Y variable takes value 1 according to the values of the explanatory variables, P(Y =1|X ), and to evaluate the relationship or effect of those on the dependent variable.
The analysis is based on the multi-variant binary logistic regression model, which assumes that the probabilities of Y variable would be 1 follow the logistic distribution and, therefore, its value can be estimated according to the following formula, named logistic function:

where:
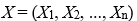 are the independent variables,
 is the constant of the model or independent term,
 are the coefficients of independent variables.
This is a continuous function and takes values in the range [0,1].
The coefficients vector is estimated by the maximum likelihood estimation, which means that coefficients are adjusted in a way to maximize the likelihood function.
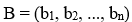
Given that a dichotomous dependent variable follows a binomial distribution, the likelihood function for a random sample of N observations is expressed by:
where:
 is the observed value (1 or 0) of the dependent variable for i sample
 is the predicted value of the dependent variable for i sample,
  .
.
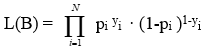
Coefficients which maximize L(B) will also maximize its logarithmic transformation. To maximize the logarithm of the likelihood function, the solution to the following non-lineal equational system must be found:
where:
 is the observed value of
  independent variable for i sample.
In the application, the Newton-Raphson iterative algorithm has been implemented in order to resolve it.
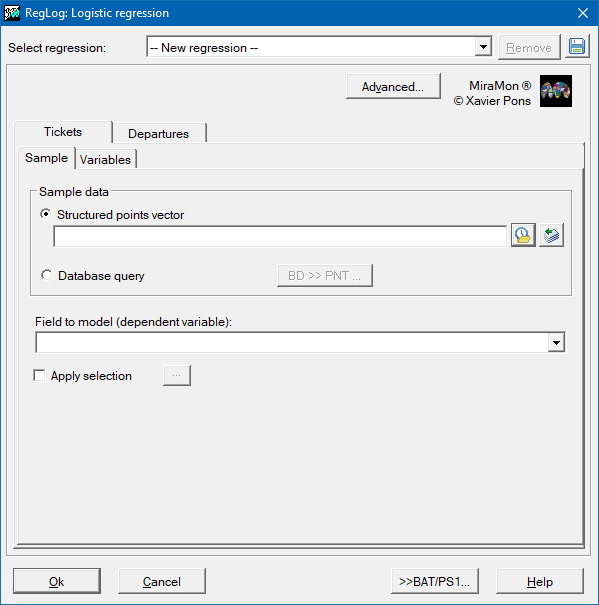
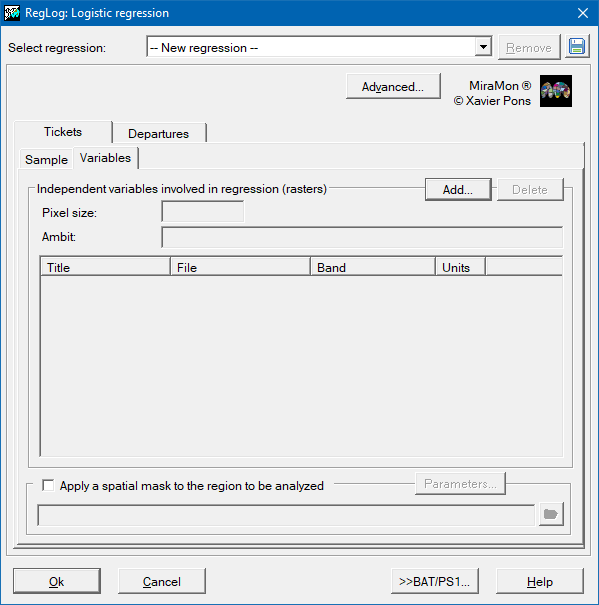
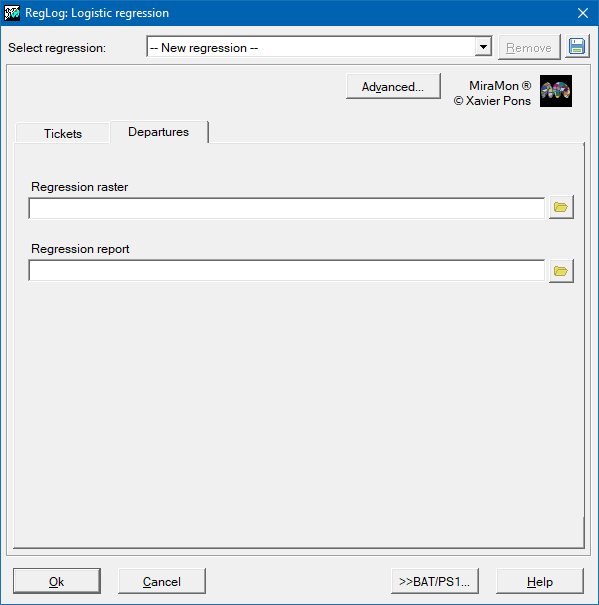
So then, to determine the coefficients of the regression, a set of samples where both the dependent variable (1 or 0) in detailed locations (point features) and the set of possible independent variables must be provided . These samples will be provided either in a PNT structured point file or in a table in any other format accessible via an ODBC (Open Database Connectivity) driver. Independent variables must be given as IMG raster format from the same geographic region and pixel size. The predictable result will also be an IMG raster format.
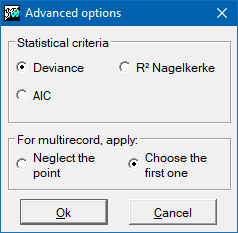
The regression procedure is, in fact, an iterative fitting process of all possible regressions: from the regression with all initially introduced independent variables to regressions with a single independent variable. Analyzing the statistical parameters of each regression and according to the chosen statistical criteria (the smaller AIC coefficient, the smaller Deviance statistics or the better R2 Naglekerke coefficient, the best considered regression of all is obtained.
More information about the logistic regression model, the maximum likelihood estimation, and the iterative Newton-Raphson algorithm can be consulted at the following reference:
Czepiel, S.A. (2002) Maximum Likelihood Estimation of Logistic Regression Models: Theory and Implementation https://czep.net/stat/mlelr.pdf.

Dialog box of the application
Syntax
Syntax:
- RegLog Adjustment SampleFile ModelField Criteria Multirecord DTMOutput TXTOutput IndepVarFiles [/MOSTRA_VALORS_CRITERIS] [/CAMPY] [/MASCARA] [/CAMP_MASC] [/TAULA_MASC] [/OPER_MASC] [/CONSIDER_NODATA] [/CAMPX] [/REFSYSTEM] /ATR_MASC /PNTdeBD
Parameters:
- Adjustment
(Adjustment option -
Input parameter): Currently it can only be worth 2.
- SampleFile
(Input sample file -
Input parameter): Input file corresponding to the sample data.
- ModelField
(Field to model (dependent variable) -
Input parameter): Field to model (dependent variable)
- Criteria
(Statistical criteria -
Input parameter):
- 0: All the variables are independent
- 1: Deviance criteria
- 2: R2 Naglekerke criteria
- 3: AIC criteria
- Multirecord
(Multirecord -
Input parameter): Indicates how to treat the multi-record input data, that is, what to do when more than one record for each point is present:
- 0: Neglect the point.
- 1: Choose the first.
- 2: Calculate the mean value.
- 3: Calculate the sum value.
- DTMOutput
(DTM output file -
Output parameter): DTM output file
- TXTOutput
(TXT output file -
Output parameter): TXT output file
- IndepVarFiles
(Files of the independent variables -
Input parameter): Files of the independent variables
Modifiers:
/MOSTRA_VALORS_CRITERIS
(Show values and criteria)
Display information on-screen for each regression. (Input parameter) /CAMPY=
(Field of the Y coordinates)
In the case of requesting the creation of a point file from the sample database, this is the selected field of the Y coordinates. (Input parameter) /MASCARA=
(Mask file)
Mask file (Input parameter) /CAMP_MASC
(Field of the chosen database.)
When the mask is a structured file, it indicates the field of the chosen database. To learn more about the values of this parameters follow the considerations in the general syntax document. (Input parameter) /TAULA_MASC=
(Table of the chosen database)
When the mask is a structured file, it indicates the table of the chosen database. To learn more about the values of this parameters follow the considerations in the general syntax document. (Input parameter) /OPER_MASC=
(Field projection operator)
Field projection operator. Just in case the mask file is a not structured polygon file. (Input parameter) /CONSIDER_NODATA
(NoData value in mask)
In the case of a mask file, consider the NoData value. (Input parameter) /CAMPX=
(Field of the X coordinates)
In the case of requesting the creation of a point file from the sample database, this is the selected field of the X coordinates. (Input parameter) /REFSYSTEM
(Horizontal reference system of the database PNT file)
If prompted to create a PNT file from the sample database, this is the horizontal reference system selected for that file. (Input parameter) /ATR_MASC=
(Selected value from the mask file)
Selected value from the mask file. Just in case the mask file is a non-structured polygon file. (Input parameter) /PNTdeBD=
(PNT file from a database)
In case the sample data is the result of a database query, a PNT file can be requested to be created if the identifiers /CAMPX and /CAMPY are also present. (Output parameter)