-
 MDTIso: Generation of contour lines from DTM
MDTIso: Generation of contour lines from DTM| Presentation | Dialog box of the application |
| Graphic examples | Syntax |
The algorithm works, internally, in two stages:
In the contour lines vertices generation stage, the DTM is swept starting by the cell placed on the top left area. For each cell, the Z value is reviewed and compared with the ones on the cells placed at left and under it and, in the case that one of the contour line levels has to be between those cells, an interpolation is made to find the point where the corresponding vertex has to be placed. Once all the vertices are generated, the contour line generation is made. From the lowest value level, and for each contour line level, each contour line is being generated from the interpolated vertices of the DTM.
The basic data required for the generation of contour lines are the DTM raster, the desired contour interval and the output vectorial file. The raster of the digital terrain model (DTM) must be a file in IMG format and the data type can be any of those supported by MiraMon (see MiraMon raster formats description). The output file will be a structured vector in ARC format.
From the contour interval value and the minimum and maximum values recorded in DTM metadata, the different contour line levels will be calculated by looking at multiples from the original value that, in case the user has not assigned it, it will be 0 by default. In case the minimum value of the DTM does not correspond to a contour line Z value, the Z value of the first contour line beyond the minimum DTM value will be chosen; for example, if the minimum of the DTM is 230 m and the contour line interval is 100 m, a minimum value of 300 m will be chosen. In case the maximum value of the DTM does not correspond to a Z value of a contour line, the Z value of the first contour line under the maximum DTM value will be chosen; for example, if the maximum of the DTM is 679 m and the contour interval is 200 m, a maximum value of 600 m will be chosen. The possibility for users to choose between which Z values they want to generate contour lines is available by the optional parameters of minimum and maximum Z value of the contour lines.
In case of generating the contour lines of two or more adjacent DTM, the algorithm allows to limit the search of contour line vertices up to a distance of half a pixel from the DTM borders. In this case, it is necessary to have a common overlap of one pixel between both DTM in order to achieve a perfect match between the contour line generation processes in both files for all their contact points. For proper overlapping, the same densification index and Z value tolerance must be assigned, in case the value of the DTM cell corresponds with the Z value of one of the contour lines, for each adjacent DTM.
The algorithm allows generating some contour lines obtained from a DTM densified at a higher resolution. This option densifies dynamically every 2 rows to generate the contour line vertices. In order to successfully develop this process, the densification index must necessarily be an integer and odd number between 1 and 9. A 1 index actually corresponds to not densifying, and a 9 index generate curves with far more vertices, which implies also a higher calculation time.
In order to avoid conflicts in the contour lines (an contour line of one or two vertices, contour lines that cannot be closed,... especially in plain areas), it is necessary to apply a Z value tolerance; this tolerance corresponds to the value-added or value-subtracted to a cell that has the same Z value of some of the contour lines levels. The value of the tolerance corresponds to parts per thousand regarding the contour interval value and can be between 0.1 and 100, or between -0.1 and -100 if an infinitesimal lowering of the heights wants to be made. The default tolerance is -1, i.e., 1 mm is reduced if the equidistance is 1 m.
Once the contour lines are generated, a generalization based on the Douglas-Peucker algorithm (1973) can be applied, which implies a simplification of the contour lines that substantially reduces the number of vertices, thus, making the file smaller, without meaning in general a noticeable decrease of the quality. Note that this is not a smoothing operation of the curves; if an important smoothing is desired, apply application GenVLin to the result, but control that the smoothing does not arrive to generate contour line intersections (that can be made by verifying that typical nodes do not appear and only final and ring nodes appear).
In case there are conflictive contour lines, this application can generate, if required, a vector structured file of points containing the ends of these contour lines. In case there are no conflictive points and all contour lines have been generated successfully, this file will not be created.
A few final tricks, in case they are needed:
For more information, consult the following reference:
Douglas D, Peucker T (1973) Algorithms for the reduction of the number of points required to represent a digitized line or its caricature. The Canadian Cartographer 10(2), 112?122 doi:10.3138/FM57-6770-U75U-7727

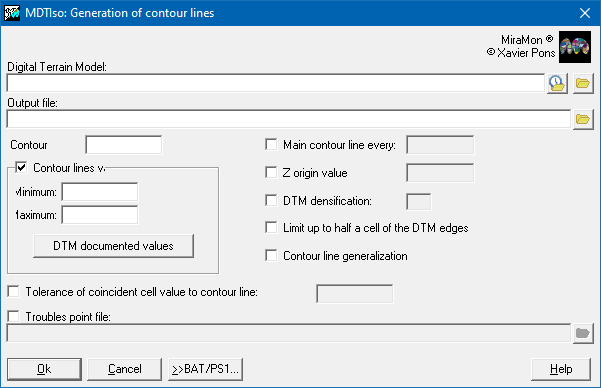 |
| MDTIso dialog box |
 Example of contour lines generation.
 Example of contour lines generation without densification (left) and with densification (right).
MDTISO C:\DTMFile.img C:\CountourLinesFile.arc 20 /EQUID_MESTRA=100 /ZMIN=128 /ZMAX=763 /ZBASE=100 /DENSIFICACIO=3 /MIGPIXEL /GENERALITZACIO /PROBL=C:\ProblsFile.pnt
MDTISO C:\DTMFile.img C:\CountourLinesFile.arc 20 /EQUID_MESTRA=100 /ZMIN=128 /ZMAX=763 /ZBASE=100 /DENSIFICACIO=3 /GENERALITZACIO /ZINCREM=10 /PROBL=C:\ProblsFile.pnt