-
 IsoMDE: Generate Digital Terrain Models from contour lines
IsoMDE: Generate Digital Terrain Models from contour lines| Presentation and options | Dialog box of the application |
| Syntax |
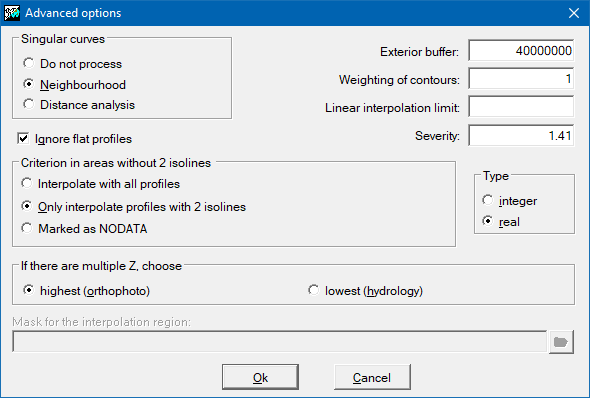
The method used by the program to obtain the raster from the isolinesdoes not consist of a single algorithm but rather a set of procedures andrules that were selected heuristically from amongst the many differentprocedures proposed in the specialised literature on the subject. The basicprocedure is to trace profiles between contour lines. Considering that thedistribution of contours often produces areas with very many lines closetogether whilst other areas have no lines in them, this method is usuallybetter than the use of point interpolation when the original data are in theform of contour lines.
These profiles are generated by using a number of different functions(constant values, linear functions, cubic splines, etc) according to thesurroundings of each point in the area. In this way problems due toexcessive generalisation when using only linear interpolation functions areavoided (hilltops and valleys are always left as horizontal surfaces). Thishybrid approach also avoids the slowness and some side-effects of alwaysusing cubic functions or other splines. In addition IsoMDE allows the userto indicate the vertical spacing between contour lines and forces non-linearfunctions to avoid excessively high or low values near hilltops orvalleys.
Another characteristic of IsoMDE is that it calculates profiles from theoriginal contours in vector format, without passing through an intermediaterasterisation. This leads to much greater precision when determining theinterpolated values along a profile. (The methods that use intermediaterasterisation inevitably base the calculations on points that have beendisplaced to the centres of cells of the raster that they are trying togenerate). Another advantage of vector calculation of the profiles is thatit is unnecessary to worry about the original scale of the data or theresulting raster cell size. In effect, when intermediate rasterisation isperformed, when two or more contours pass through a single raster cell onlyone of them is taken into account in the final calculation. Although thechoice of value can greatly affect the end result the user does not usuallyhave any adequate control over this (the majority of rasterisation programssimply assign the value of the first or the last contour that passes througha cell).
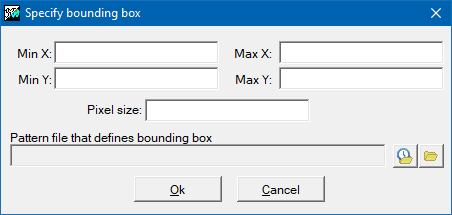
A second advantage of using vectors is that they easily allowconsideration of curves located outside the area of the output raster and totake these heights into account without having to carry out the process on alarger raster which must be clipped subsequently.
Another advantage of using vectors is that it avoids the problems that occurwhen a line crosses a raster at 45 degrees and is rasterised as a diagonal.When this happens profiles traced along the opposite diagonal can cross thecurve without seeing it and so do not take it into account.
This vector approach may be considered to be slow, but it should beremembered that during the process of rasterising isolines it is alsonecessary to carry out an analysis of the intersections, so that what isproposed here only amounts to an approximate increase in processing time bya factor of 4. Despite this, however, we avoid having to write a raster fileto disk and we create a basis for the subsequent determination ofinterpolated values that is much more precise. Furthermore, this increase inprocessing time is never critical in the overall process of generating afinal DTM from contour lines.
Despite its name, IsoMDE is not limited to isolines as the basicinformation in the interpolation process. In effect, and although thecontour lines constitute the principal source of data, the program can alsouse valuable additional information found in lines of hillcrests andvalleys, as noted by the work of Peuker. In particular it is worth notingthat the information relating to the position of valley floors is oftenavailable, frequently in explicit form since topographic maps usuallyinclude this information in the form of the river network.
IsoMDE allows the existence of lines of hill crests and valley bottoms tobe taken into account simply indicating their corresponding ARC files. Whenthe analysis of profiles finds one of these lines, IsoMDE ensures that atthat point there is either a maximum or minimum, respectively when theselines are not 3D, or since MiraMon version 4, with the possibility of usingelevation information for each vertex, if a hill or valley line contains a Zvalue, these are used in the interpolation when the profile intersects theline of the crest or valley. Even when the lines do not include Z values foreach vertex they are still of great value to IsoMDE since they can be usedto better determine the morphology of the relief. The improvement in theresults are especially noticeable in plane areas with few contour lines andwhere knowledge of the lowest line (a river) is of great help to avoiderrors due to the lack of information. It is worth emphasising theadvisability of using valley features in the process. It is also worthremembering that, despite the fact that this type of information is rarelyavailable in older digital maps or those obtained from the digitisation ofpaper topographic maps, nowadays most photogrammetric restitution processesprovide the height of all the vertices of all the elements digitised, sothat valley lines (or hillcrests if there are any) are 3D containingelevation information that can be used by IsoMDE.
The program traces 4 profiles from each cell (horizontal, vertical andtwo diagonals at 45º and 135º) to find the information on the surroundings(contour lines, valleys, etc), in the same way as many previously describedalgorithms, all essentially based on Douglas's algorithm. It is alsopossible to ask the program to trace additional profiles at 22.5º, 67.5º,etc; we strongly recommend choosing this option. In IsoMDE the final rastercell value is not based on the value of just one of the profiles (typicallythe one with the greatest slope) but rather all the profiles are used tofind a final value. This produces smoother results with less plane surfacesthan those obtained by simple selection methods and we avoid having tosmooth the final DTM by applying averaging filters. It is worth rememberingthat the use of such filters reduces the accuracy especially for points forwhich the elevation is well known - such as points on the contour lines.This degradation can be made worse especially in cases where the averagingfilter is applied more than once in an attempt to remove the star-likeeffects that can often be seen when a single profile is used for each celland when sudden changes in the relief occur due only to the fact that thealgorithm switches the criterion for selecting which profile line to use tocalculate the final height.
The way in which each profile contributes to the final value in each cellcan be selected from a simple average of the values to a weighted averagethat favours the curves closest to each point (the default and recommendedoption). This option is possible because IsoMDE also obtains informationabout the relative position of the profiles when tracing them. Thanks tothis IsoMDE returns an exact interpolation and we obtain the original valuesin the centres of those cells that lie at the same point as an original datapoint.
Despite the relative complexity of the method, extra care has been taken in its implementation so that the IsoMDE is as fast, if not faster, thanother similar programs.
To obtain best results use a pixel size of between 1mm and 0.2mm on theoriginal map scale. For example, if the source of the contour lines is a1:50,000 topographic map, use a pixel of between 50m and 10m. Our experiencesuggests that to avoid artefacts due to the lack of information in areasthat are flat relative to the contour spacing on the typical topographicmaps, it is usually better to generate the DTM with a cell dimensionequivalent to 1mm in the map scale. (For example, if the map is 1:50,000,create a DTM with a 50m pixel). If a DTM with a smaller cell is needed,resample the raster to the desired size using DensRas (menú"Herramientas | Organización espacial | Densificación derásters").
In maps with abrupt relief (high density of contours) reasonably goodresults will be obtained by interpolating directly with a pixel sizeequivalent to 0.5mm (25m for contours taken from a 1:50,000 map). We do notadvise trying to calculate DTMs with more detailed sizes, since it isdoubtful whether most topographic maps contain sufficiently good informationat less than 1mm whilst at the same time such small grid sizes lead tonumerous artefacts as a result of the lack of information available at suchdetail. Under no conditions should you try to generate a DTM with a pixelsize of less than 0.2mm since no topographic maps provide this precision andthe only results will be longer processing times and a dramatic increase inartefacts. If a smaller pixel size is really needed then apply DensRas aftergenerating the DTM with the above recommended pixel size.
If, after generating the DTM, lines appear that break the expected formof the relief (flat hill tops or valley floors, angular surfaces) thendigitise intermediate isolines or, if these irregularities appear near theborders, work with a wider area to help the interpolator with a betterknowledge of the surrounding areas. As an additional measure an averagingfilter may be used on the output, although this should not be necessary ifthe original data was of good quality and the procedure has been followedproperly. Remember that filtering the image smoothes the relief, which maybe quite unrealistic. During the testing phase of the development of IsoMDEgood results were always obtained when the original data was of good qualityand when the model had a resolution equivalent of 1mm in the original mapscale. In these conditions it should not be necessary to pass any filter, orin the very worst case, no more than once.
The program assumes that the units used for the elevations in thedatabase field are the same as those in the reference system. If this is notthe case it will be necessary to carry out the appropriate conversion beforeusing the program. For alternative methods to interpolation see alsoInterPNT y DensRas.
Reference to cite the method:
Pons, X., Dalmases, C., Pesquer, L., Marcer, A., Masó, J. (2004) ISOMDE: Una nueva aproximación a la generación de Modelos Digitales del Terreno. Conesa C, Martínez Guevara JB. Territorio y Medio Ambiente. Métodos cuantitativos y Técnicas de Información Geográfica, p. 27-38 (367 p). Asociación Española de Teledetección y Universidad de Extremadura, Cáceres.
XI Congreso del GMCSIGT Tomo I.pdf XI Congreso de Métodos Cuantitativos, Sistemas de Información Geográfica y Teledetección de la Asociación de Geógrafos Españoles (AGE), Murcia.
In addition to the original reference provided before (which is the one to be used to cite the method), a higher quality printout can be accessed at https://www.infoambiental.grumets.cat/Biblio/IsoMDEComunicacion.pdf, as well as an automatic translation at https://www.infoambiental.grumets.cat/Biblio/IsoMDEComunicacion_Automatic_translation_to_English_by_Google.pdf

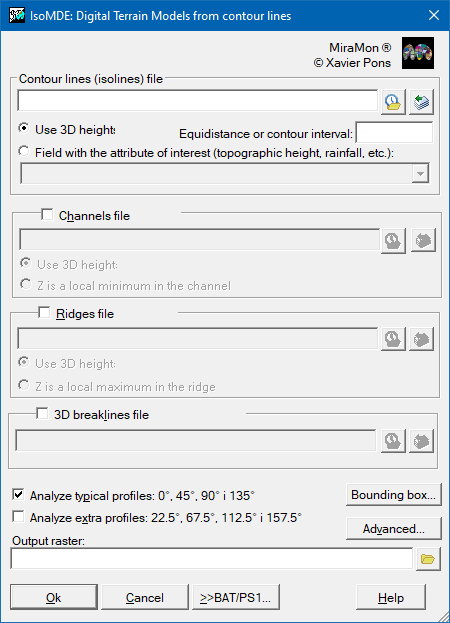   |
| IsoMDE dialog box |