-
 EstdGrup: Fields statistics by grouping records according to values present in other fields
Direct access to online help: EstdGrup
Access the application from the menu: "Tools | Alphanumerical databases | Statistics of record groups"
Presentation and options
This application carries out statistical calculations for one or more fields of a database (usually linked to a structured vector layer). These statistics are calculated and classified according to groupings defined by the user.
In order to define the operation that this application will perform, the different fields of the database will be called grouping fields, calculated fields or simply non-participating fields.
The grouping fields are those which classify results according to the different values of each of these fields. Once a grouping field has been created, the program determines the number and the characteristics of the different values which are included in its database, which is organized in related form according to the identifiers of the graphic objects of the main table; all the different values of a field found in the database and considered as a whole are known as the field projection. The values of the indicated statistics for each calculated field are calculated for each element of the projection of the grouping field.
The calculated fields are the fields of the database about which the user wishes to know specific statistical calculations. The user can choose which statistics are calculated for each calculated field. Depending on the treatment that each field receives (normally quantitatively for numerical fields and categorically for the rest of the fields) the user can choose one or all the following statistical calculations:
-
Both treatments:
- Number of total records (includes NoData (1))
- Number of records with data (excluding NoData (1))
- Number of values of one element of the projection in relation to the total number, in percentage and without taking into account NoData values (1)
- Number of values of an element of the projection in relation to the total number, in percentage and taking into account the NoData values (1)
-
Categorical treatment:
- Mode; if there is more than one mode, this will be the first value
(2)
- Occurrence percentage of the mode excluding the NoData values
- Shannon index
- First value (2)
- Last value (2)
-
Quantitative treatment:
- Mean
- Standard deviation (dividing between N)
- Variance (dividing between N)
- Sum
- Rank (for whole numbers, 1+max-min)
- Minimum
- Maximum
- Median
- Mean absolute deviation around the median
(1) NoData for a database includes the explicit NoData values, empty records and blank records.
(2) For the numerical treatment the order is natural (1,2,3...), but for the categorical treatment it is necessary to take into account the type of order used; this is a non-strict alphabetical order, based on the order of the ASCII codes corresponding to each character. This means that A naturally comes before B, but, on the other hand, that a or à come after B.
In quantile calculations, such as the median, it is possible to indicate, with the modifier /MEDIANA_EMPAT=, the type of tiebreaker to use for its calculation when the position of the quantile is between two values of the series. For more information, see general syntax.
The result of the statistical analysis can be presented in three formats:
- HTM: A single file in HTML format is generated which shows the statistical results for each defined grouping level in tabular form.
- DBF: a DBF table is generated for each grouping field with all the records and values that the projection of the grouping field has and with the statistics of each calculated field as fields of this DBF table.
- CSV: A spreadsheet in text format with a list separator (usually the character ;) is generated which has the same structure as the HTM format.
Depending on the output formats, the program has the following modes of operation:
EstdGrup HTM:
This option carries out statistical calculations for one or more fields of a database (usually linked to a structured vector layer). These statistics are calculated and classified according to groupings defined by the user. The results of the statistics are saved in HTML file.
EstdGrup DBF:
This option carries out statistical calculations for one or more fields of a database (usually linked to a structured vector layer). These statistics are calculated and classified according to groupings defined by the user. The results of the statistics are saved in DBF file in the destination directory.
EstdGrup CSV:
This option carries out statistical calculations for one or more fields of a database (usually linked to a structured vector layer). These statistics are calculated and classified according to groupings defined by the user. The results of the statistics are saved in CSV file.

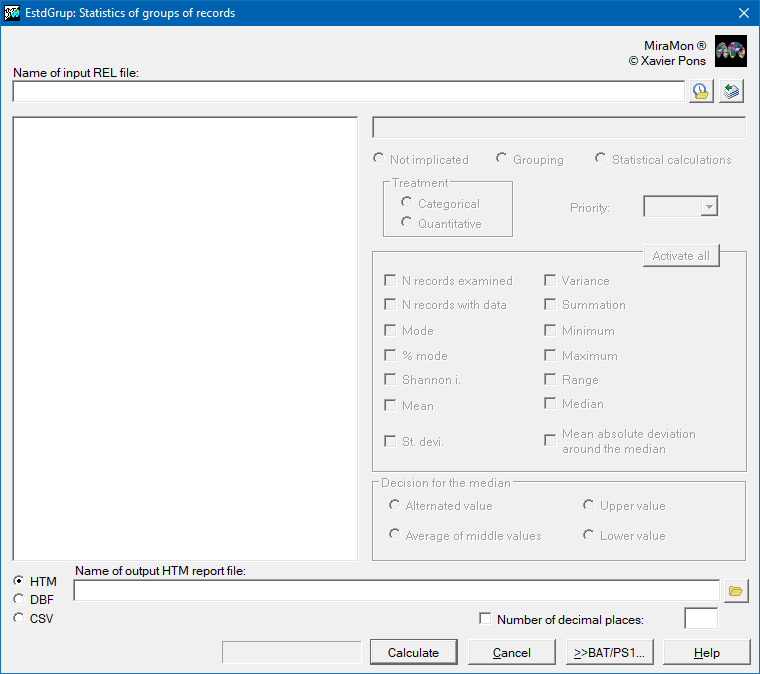
Dialog box of the application
Syntax
Syntax:
- EstdGrup Option OriginFile DestFile [/GRP_#] [/ESTD_#] [/CAT_#] [/NUM_#] [/N_REG_TOTALS_#] [/N_REG_DADES_#] [/PRCNT_MODA_#] [/MODA_#] [/I_SHAN_#] [/MITJANA_#] [/DESV_STD_#] [/VAR_#] [/SUMA_#] [/MIN_#] [/MAX_#] [/PRCNT_GRUP_#] [/PRCNT_GRUP_NODATA_#] [/MEDIANA_#] [/DESV_MEDIANA_#] [/MEDIANA_EMPAT_#=] [/N_DECIMALS]
- EstdGrup Option OriginFile DestDir [/GRP_#] [/ESTD_#] [/CAT_#] [/NUM_#] [/N_REG_TOTALS_#] [/N_REG_DADES_#] [/PRCNT_MODA_#] [/MODA_#] [/I_SHAN_#] [/MITJANA_#] [/DESV_STD_#] [/VAR_#] [/SUMA_#] [/MIN_#] [/MAX_#] [/PRCNT_GRUP_#] [/PRCNT_GRUP_NODATA_#] [/MEDIANA_#] [/DESV_MEDIANA_#] [/MEDIANA_EMPAT_#=] [/N_DECIMALS]
- EstdGrup Option OriginFile DestFile [/GRP_#] [/ESTD_#] [/CAT_#] [/NUM_#] [/N_REG_TOTALS_#] [/N_REG_DADES_#] [/PRCNT_MODA_#] [/MODA_#] [/I_SHAN_#] [/MITJANA_#] [/DESV_STD_#] [/VAR_#] [/SUMA_#] [/MIN_#] [/MAX_#] [/PRCNT_GRUP_#] [/PRCNT_GRUP_NODATA_#] [/MEDIANA_#] [/DESV_MEDIANA_#] [/MEDIANA_EMPAT_#=] [/N_DECIMALS]
Options:
- HTM (or 1): A report of the result of the statistical calculations is generated in HTML format.
- DBF (or 2): As many tables in DBF format are generated as there are grouping fields in the destination directory. Each table contains the statistical results of its corresponding grouping field.
- CSV (or 3): A spreadsheet in CSV format (which defines the fields using a list separator) is generated with the result of the statistical calculations.
Parameters:
- OriginFile
(Origin File -
Input parameter): REL file corresponding to the database of a structured vector layer, or DBF table, with which the selected statistical calculations are carried out.
- DestFile
(Destination File -
Output parameter): For HTM (1) and CSV (3) options this is the file that will contain the results of the statistical calculations indicated.
- DestDir
(Destination Directory -
Output parameter): This is the directory in which the results of the corresponding DBF tables generated by each grouping field will be written.
Modifiers:
/GRP_#= (Grouping Field #) Name of the field that acts as a grouping field with # order of priority. The value of this variable will contain an alphanumerical text constructed according to the field name and its links from the main table. N grouping fields can be used, where # is the number of the grouping field (GRP_1, GRP_2,...). The priority order begins with value 1, which indicates the most general grouping level. More information at general sintax. (Input parameter) /ESTD_#= (Statistical Field#) Name of the field in which different statistical calculations, identified by the # index, are carried out. This index only indicates an order in which the different calculated fields are displayed. It is possible to make statistics over N fields. Its value is constructed in the same way as /GRP_#. (Input parameter) /CAT_# (Categorical treatment) Indicates categorical treatment of the field identified by /ESTD_#. (Input parameter) /NUM_# (Quantitative treatment) Indicates quantitative treatment of the field identified by /ESTD_#. (Input parameter) /N_REG_TOTALS_# (Total number of records) For the field identified by /ESTD_# the total number of records (including empty, blank or NoData records) is wanted to be known. (Input parameter) /N_REG_DADES_# (Number of records with data) For the field identified by /ESTD_# the number of records with data (excluding empty, blank or NoData records) is wanted to be known. (Input parameter) /PRCNT_MODA_# (Modal Percentage) Indicates that the occurrence percentage of the modal value for the field identified by /ESTD_# in a categorical treatment is wanted to be known. (Input parameter) /MODA_# (Mode) Indicates that the mode for the field identified by /ESTD_# in a categorical treatment is wanted to be known. (Input parameter) /I_SHAN_# (Shannon index) Indicates that the Shannon index for the field identified by /ESTD_# in a categorical treatment is wanted to be known. (Input parameter) /MITJANA_# (Mean) Indicates that the mean for the field identified by /ESTD_# in a quantitative treatment is wanted to be known. (Input parameter) /DESV_STD_# (Standard deviation) Indicates that the standard deviation for the field identified by /ESTD_# in a quantitative treatment is wanted to be known. (Input parameter) /VAR_# (Variance) Indicates that the variance for the field identified by /ESTD_# in a quantitative treatment is wanted to be known. (Input parameter) /SUMA_# (Sum) Indicates that the sum of all the values for the field identified by /ESTD_# in a quantitative treatment is wanted to be known. (Input parameter) /MIN_# (Minimum) Indicates that the minimum values for the field identified by /ESTD_# in a quantitative treatment, or the first value of an ascending alphabetical order for the categorical treatment is wanted to be known. (Input parameter) /MAX_# (Maximum) Indicates that one wishes to know the maximum value for the field identified by /ESTD_# in a quantitative treatment, or the last value of an ascending alphabetical order for the categorical treatment. (Input parameter) /PRCNT_GRUP_# (Total values numbers) Indicates that one wishes to know the total number of values of an element of the projection with respect to the total number of values for the field identified by /ESTD_#. NoData values are not taken into account in this calculation. (Input parameter) /PRCNT_GRUP_NODATA_# (Total values number considering NoData) Indicates that one wishes to know the percentage of the value in relation to the total number of values of the projection of the field identified by /ESTD_#. NoData values are taken into account in this calculation. (Input parameter) /MEDIANA_# (Median) This indicates that you want to know the median of all the values for the field identified by /ESTD_# in a quantitative treatment. (Input parameter) /DESV_MEDIANA_# (Mean of the absolute deviation around the median) This indicates that the mean of the absolute deviation around the median of all the values for the field identified by /ESTD_# in a quantitative treatment has to be calculated. (Input parameter) /MEDIANA_EMPAT_#= (Decision for the median) If the calculation of a quantile (such as the median, a quartile or a percentile) has been requested, it indicates the tiebreaking criterion to be used for its calculation. To learn more about the values of this parameter, please consult general syntax document. (Input parameter) /N_DECIMALS= (Decimals number) Number of decimal figures for the results of the statistics that correspond to a non-integer numerical value. If not specified, the value defined in the MiraMon.par configuration file is used. (Input parameter)