-
 AutoCor: Spatial autocorrelation analysis (Moran)
AutoCor: Spatial autocorrelation analysis (Moran)| Presentation | Dialog box of the application |
| Syntax |
This application allows quantifying the degree of spatial autocorrelation of a variable in a raster file by calculating an indicator, in this case the Moran's I(i) index.
Spatial autocorrelation is a property present in the spatial distribution of a variable if the values at any location are influenced by values at nearby locations (following Tobler's first law of Geography https://en.wikipedia.org/wiki/Tobler%27s_first_law_of_geography). The concept of "closeness" will be referred to the autocorrelation threshold, limit distance where autocorrelation is very low or non-existent. This threshold is useful to impose the ideal spatial conditions on the sampling of the variable and certain associated statistical models.
Moran's I index is calculated with the following formula:
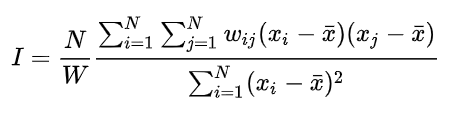
where:
 is the number of spatial units, indexed by i and j;
  is the variable of interest;
  is the mean of the variable of interest;
  is an element of a matrix of spatial weights with zeros on the diagonal;
  is the sum of all the elements of the weight matrix, that is:
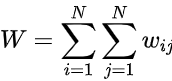 .
.
The weight matrix formed by the set of it can be defined following the movement of chess rooks, or following the movement of the chess queen. In both cases the matrix assigns a weight of 1 to neighboring cells in the north, south, east and west directions. In the first case a weight of 0 is assigned to the other directions (diagonals), while in the second case a weight of 0.70711 (=0.5·√2) is assigned to the other directions.
Spatial autocorrelation makes it possible to identify spatial patterns other than purely random patterns and regular patterns, such as a chess board. In the example of the chess board, and applying the criterion of weights of 4 neighbors in a cross, the index obtained has a value of -1; on the other hand if the white checkers (squares) are stacked in one half of the board and the black ones in the other, the index approaches +1 as N increases; finally, in a random layout of the checkers the returned index will be a value close to 0. Values smaller than -1 or larger than +1 are possible, but usually correspond to highly skewed situations in the histogram and with some values with very few neighbors in relation to the distance analyzed.
More information can be consulted at the following reference:
Goodchild, M.F. (1986) Spatial Autocorrelation. Concepts and Techniques in Modern Geography (CATMOG) n. 47, Geo Books, Norwich. 56 p. https://alexsingleton.files.wordpress.com/2014/09/47-spatial-aurocorrelation.pdf
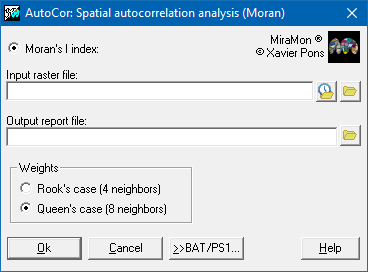 |
| AutoCor dialog box |