| Presentation and options | Dialog box of the application |
| Graphic examples | Syntax |
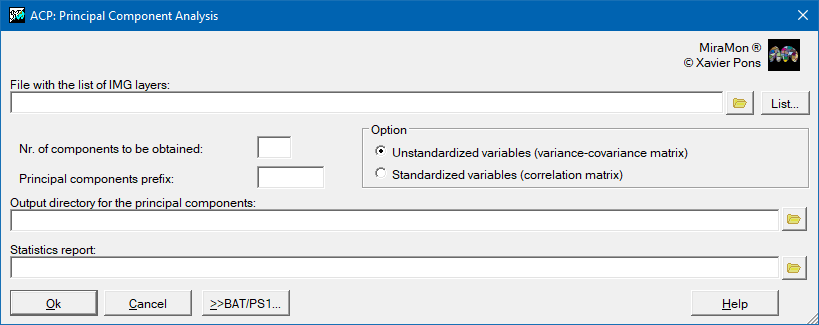
This application allows a Principal Component Analysis (PCA) on raster images (that are treated as variables), based on the variance - covariance matrix or correlation by calculating the corresponding eigenvalues and eigenvectors.
We must consider that in case of correlation between bands, the first principal component contained the largest amount of variability in the data, and each subsequent component contains a part of the remaining variability. The number of components you get will be determined by the user and it must not to be greater than the number of bands included in the analysis. The option of the ACP by non-standard variables (array variance - covariance) or standardized variables (correlation matrix) depend on the objective sought. If the goal is to weigh the same way all the bands, you must use the correlation matrix, while if you want to give greater prominence to those bands that have higher variance, you must use the variance - covariance matrix.
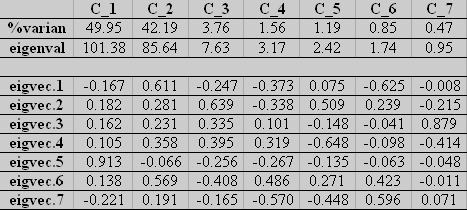
Each eigenvalue represents the variance that contains that main component, while the eigenvector indicates the weighting to be applied to each of the bands for the main component (equivalent to regression coefficients in a standard linear transformation, being the bands of the image the independent variables and the principal components, the dependent ones).·The file generates a table of statistics (Table 1) that consists of a list of the eigenvectors associated with each value as a column. The rows of this matrix are used to perform the inverse transformation from components and obtain the original bands. It also indicates the values associated with each eigenvector and the percentage of variance explained by that component.
 |
| Matrix of eigenvalues, eigenvectors, and percentage of variance associated with each component. |
Therefore, the component 1 will be explained by the linear function:
C_1 =-0.167 * X1 + 0.182 * X2 + 0.162 * X3 + 0.105 * X4 + 0.913 * X5 + 0.138 * X6 -0.221 * X7
The reverse process of the ACP offers the ability to remove noise (banding or striping, for example) some images in the process of reconstruction of the original images. To that end, PCA is performed in non-standard with all the bands and then use the table that is created to identify the components with the minimum variance explained (the first three in this case gathers over 95%·of variance). Thus, in this example could be used only these three components for the original images by eliminating the noise of the last components. The operation would have to do to get the first band would be:
Band 1 = -0.167 * C_1 + 0.611 * C_2 - 0.247 * C_3
And so on with other bands.
The calculations were made in double precision for greater robustness against highly correlated band. NoData values are excluded from the calculation.
The data of the output images are always in real, where REL also extra tablets.
IMPORTANT NOTE: The order of the coefficients of the bands used in TXTOutput is the same as presented in the ListIma file, and it is independent of the order presented in the metadata when the bands belong to a multiband REL. This observation is relevant because in some sensors, such as the Landsat TM satellites, the order of the bands is not the spectral order, so if the coefficients have to be applied attention should be paid to used them in the same order than in (ListIma) (which, on the other hand, is also the order provided in the report).
 |
| Principal Component Analysis dialog box |
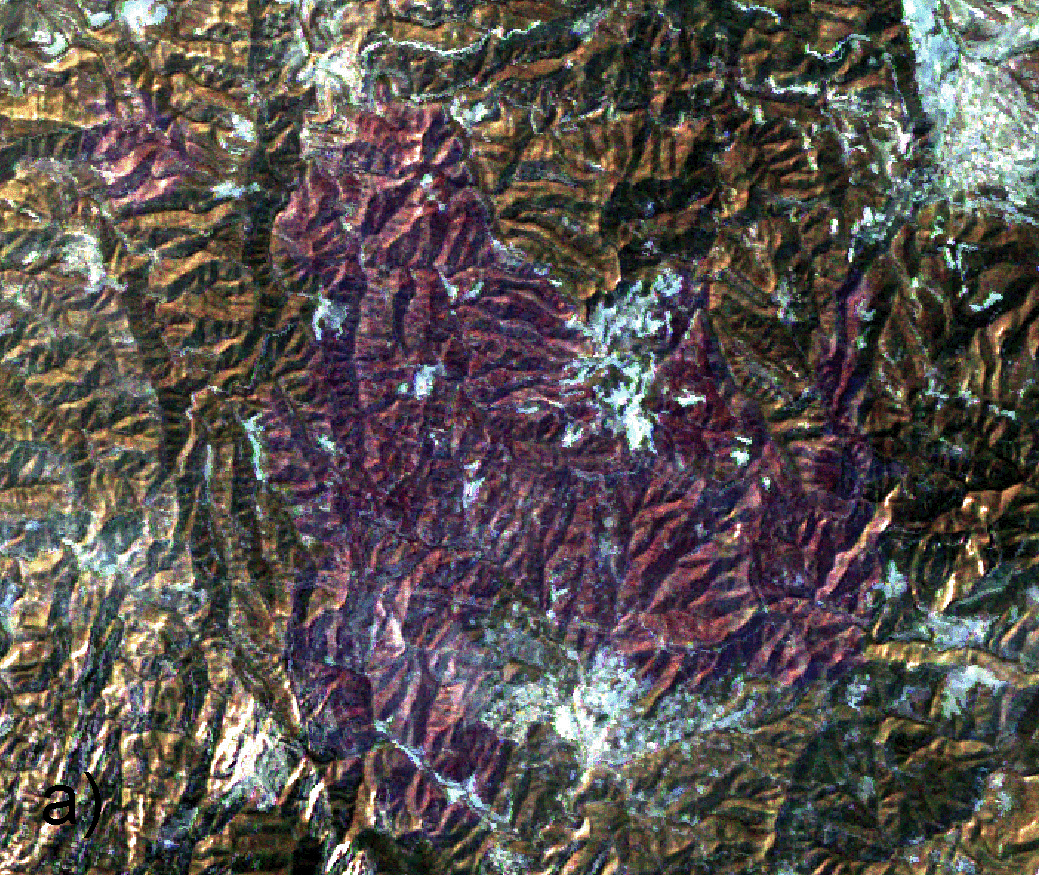
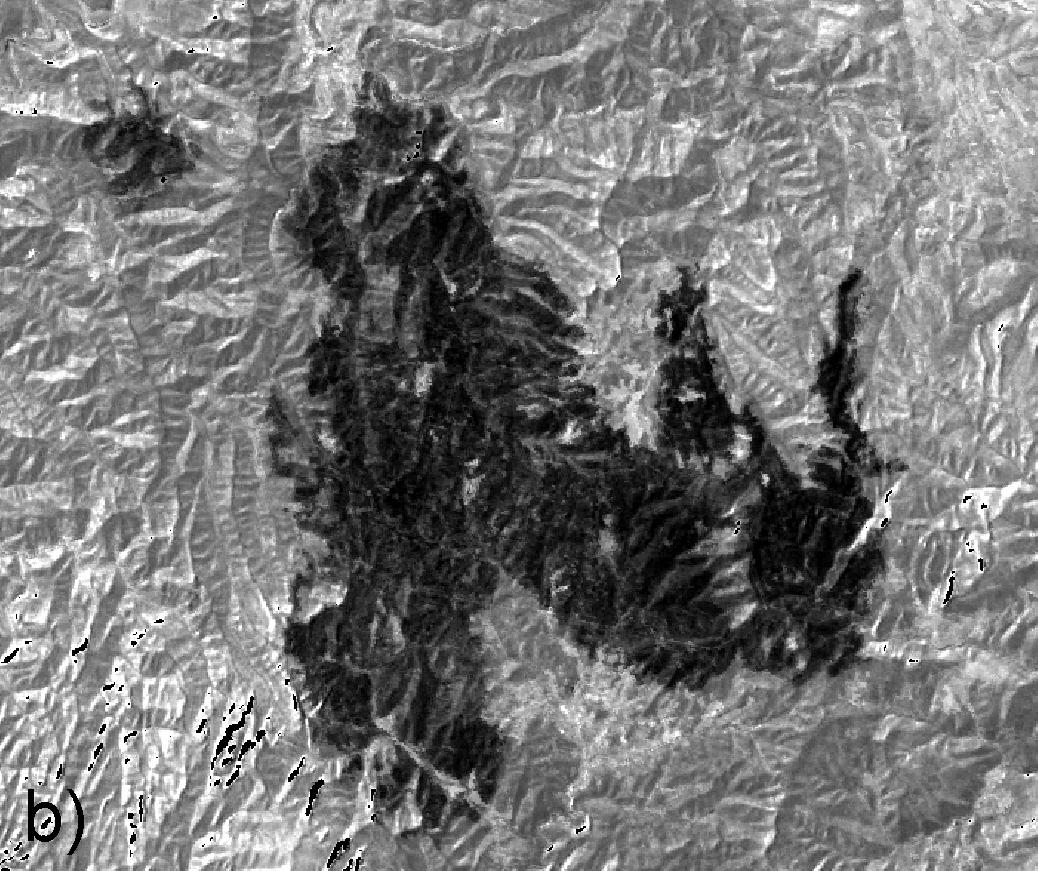
ACP applications are varied: enhancement prior to visual interpretation (Figure 1), processing prior to classification as a useful technique for reducing the dimensionality of the data in cases of multi-temporal analysis or hyperspectral data, denoising, etc.
  |
| RGB combination of Landsat-5 (a) compared to the ACP component 1 (b) made with that image. The Component 1 showed the presence of the burned area. |