HYDRO 1K Elevation Derivative Database
U.S. Geological Survey EROS Data Center
Africa region 0-35 S, 8-43 E.

View Maps
Flow Directions

Flow accumulations
Drainage Basins
Streams
Whole Africa region 0-35 S, 8-43 E.
View images of whole Africa
Original source:
 http://edcwww.cr.usgs.gov/landdaac/gtopo30/hydro
HYDRO1k is a geographic database aimed at providing comprehensive and
consistent global coverage of topographically derived data sets,
including streams, drainage basins and ancillary layers derived
from digital elevation models. Developed from the USGS' recently
released 30 arc-second digital elevation model (DEM) of the world
(GTOPO30), HYDRO1k provides a suite of geo-referenced data sets,
both raster and vector, which will be of value for all users who
need to organize, evaluate, or process hydrologic information on
a continental scale.
Developed by the U.S. Geological Survey's EROS Data Center with
assistance from UNEP/GRID Sioux Falls, the HYDRO1k project's goal
is to provide to users, on a continent by continent basis, hydrologically
correct DEMs along with ancillary data sets usable in continental-scale
modeling and analysis. Eight derivative data sets, six raster and two
vector, are being extracted from GTOPO30 for each continent.
The six raster data sets are:
- Hydrologically correct DEM,
- Shaded Relief representation of the DEM,
- Slope,
- Aspect,
- Flow Directions,
- Flow accumulations.
The derived stream network and drainage basins are being distributed
as vector data sets.
Hydrologically correct DEM

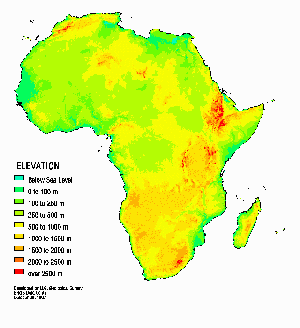
The hydrologically correct DEM forms the basis of all the
additional HYDRO1k data sets. This DEM has been processed to
fill all spurious sinks, while maintaining sinks that are
natural occurrences in the landscape. This time-consuming
process yields a DEM, which will properly transport water
across its surface.
Shaded Relief representation of the DEM
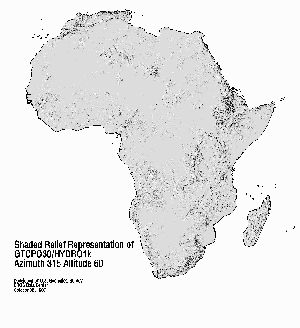
The shaded relief representation of the DEM was generated using
ARC/INFO's Slope-Aspect Index (SAI function) with a vertical
exaggeration of 15. The values of the Shaded Relief representation
vary from 0 to 255. An example colormap file using an angle of
illumination of 315 ř from north and 60ř from the horizon
(az315at60) has been used to display the image at right.
Slope
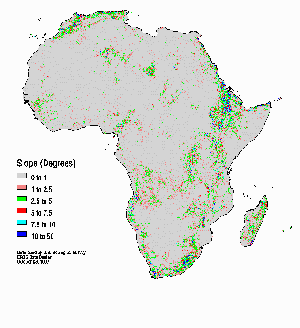
The slope data set describes the maximum change in the elevations
between each cell and its eight neighbors. The slope is expressed
in integer degrees of slope between 0 and 90. The slope image
displayed here and available for distribution was created using
ARC/INFO's slope function.
Aspect
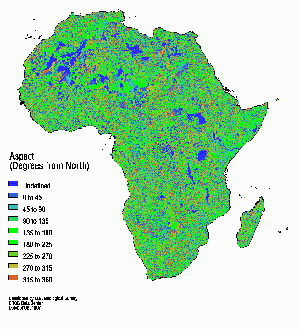
The aspect data set describes the direction of maximum rate of
change in the elevations between each cell and its eight neighbors.
It can essentially be thought of as the slope direction.
It is measured in positive integer degrees from 0 to 360,
measured clockwise from north. Aspects of cells of zero slope
(flat areas) are assigned values of -1.
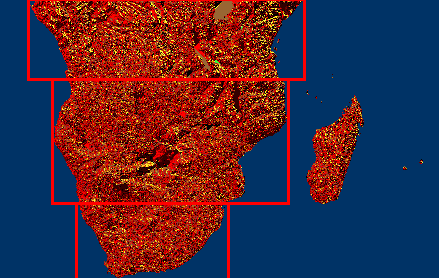
Flow Directions

The flow direction data set, like all of the other raster data sets,
has been derived from the hydrologically correct DEM. It defines
the direction of flow from each cell to its steepest down-slope
neighbor.
Values of flow direction vary from 1 to 255. Defined flow directions
follow the convention adopted by ARC/INFO's flow direction
implementation:
Cells with undefined direction of flow represent sinks and have flow
directions that are simple combinations of its neighbors' flow
direction values. (See ESRI documentation). Generation of basins
and stream networks requires the flow direction data set.
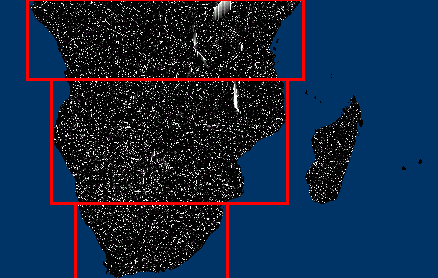
Flow accumulations
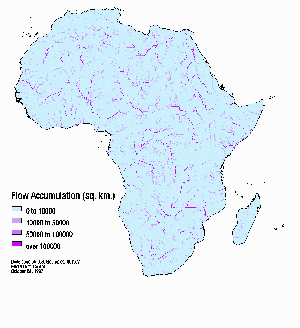
The flow accumulation data set defines the accumulated flow to each
cell. Accumulated flow is determined by summing the number of cells
that flow into the target cell. Direction of flow is determined from
the flow direction data set. Since the cell size of the HYDRO1k data
set is 1 km, the flow accumulation value translates directly into
drainage areas in square kilometers. Values range from 0 at
topographic highs to very large numbers (on the order of millions
of cells) at the mouths of large rivers.
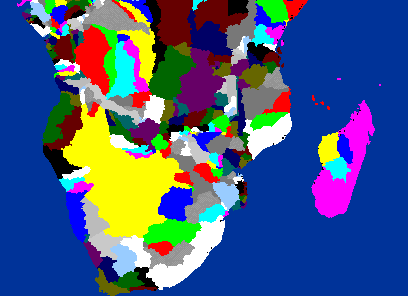
Drainage Basins

The drainage basins distributed with the HYDRO1k data set
suite are derived using the vector stream networks along with
the flow direction data set. Each polygon in the basin data set
has been tagged with a Pfafstetter code uniquely identifying each
sub-basin. The five or six digit Pfafstetter codes assigned to each
basin carry basin linkage information. This permits determination
of basin interconnectedness through simple examination of the
Pfafstetter code. Techniques for aggregating and disaggregating
the subbasins are described. (See Verdin & Verdin).
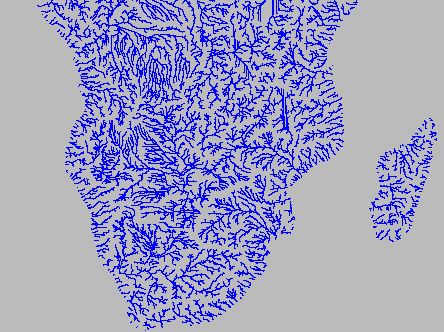
Streams
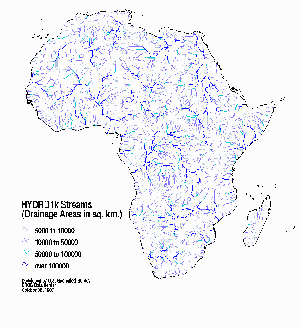
The stream network data set is derived by thresholding the flow
accumulation data set at 1000 km2. The resulting raster data set
is then processed to identify the stream links and each stream link
tagged with its flow accumulation value. This results in a vector
stream network which carries the DEM derived flow accumulation values
as an attribute. This vector data set is available in an ARC/INFO
export format.
The HYDRO1k data sets are being staged for Internet distribution,
as they become available, continent by continent. To date (October 1997),
North America and Africa are complete and available for distribution.
Comments to the original datasets
The African HYDRO1k data sets were completed in October 1997.
The projection used is the Lambert Azimuthal Equal Area projection.
The projection is centered at 5° S, 20° E and the cell size of 1 km.
The projected raster data sets consist of 9194 rows by 8736 columns.
Detailed descriptions of the techniques used in the development of
the HYDRO1k data set can be found in the
Readme file.
References
Verdin, Kristine L., A System for
Topologically Coding Global Drainage Basins and Stream Networks
(presented at the 1997 ESRI International User Conference)
 Hydrologically correct DEM (0-35 S, 5-60 E)
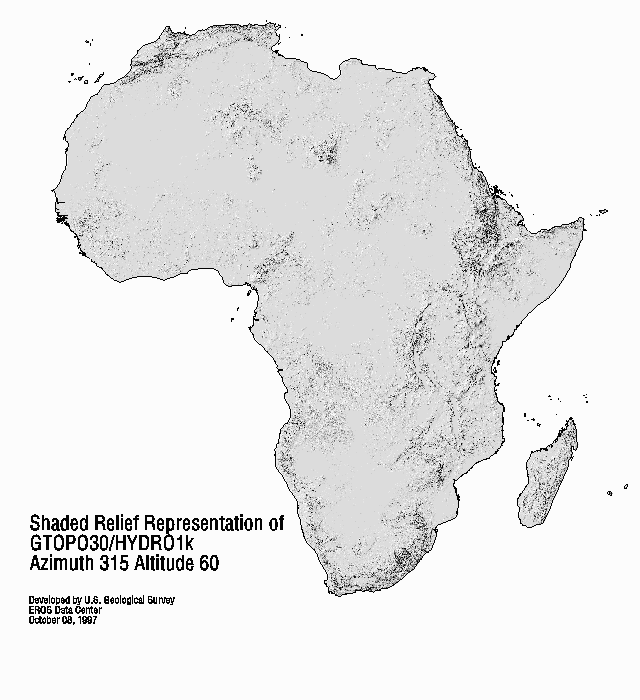 Shaded Relief representation of the DEM (0-35 S, 5-60 E)
 Slope (0-35 S, 5-60 E)
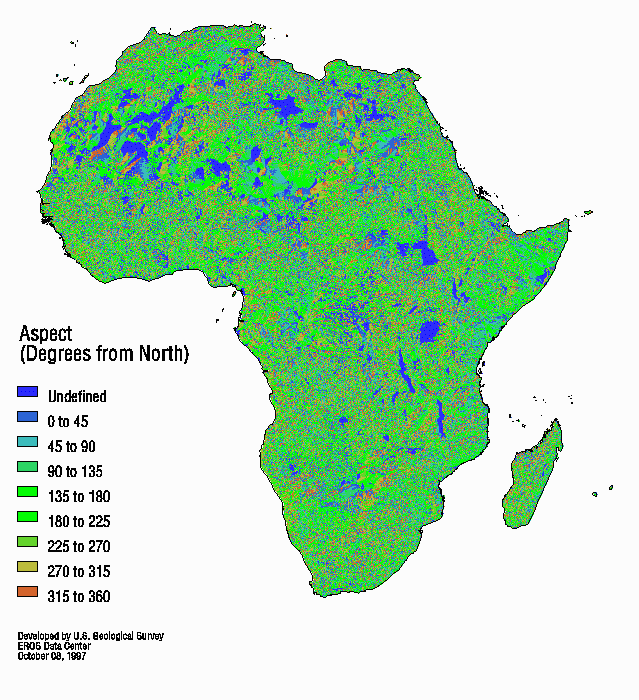 Aspect (0-35 S, 5-60 E)
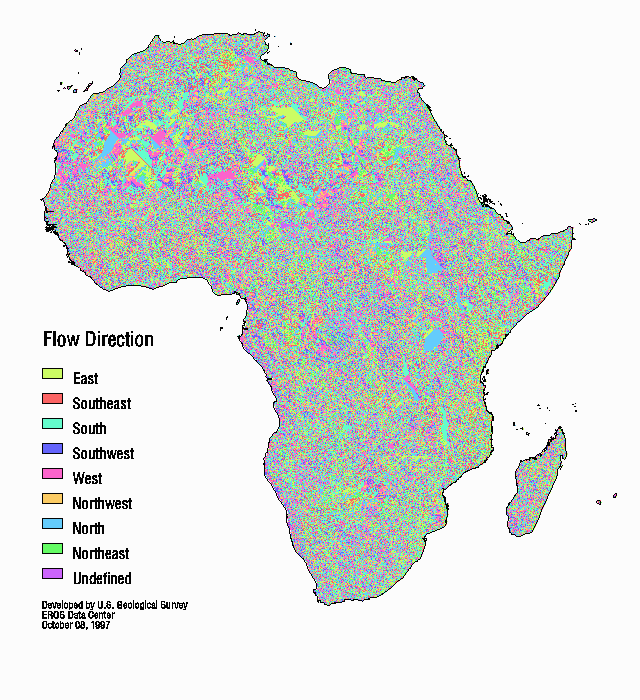 Flow Directions (0-35 S, 5-60 E)
 Flow accumulations (0-35 S, 5-60 E)
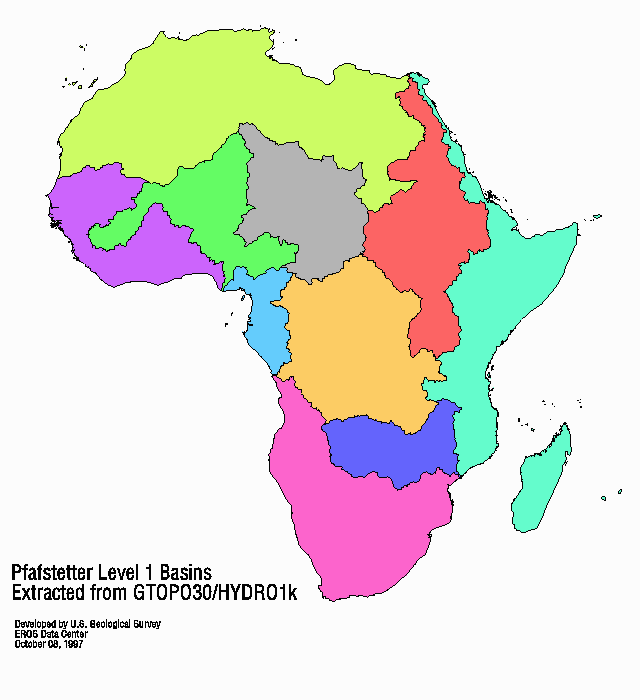 Drainage Basins
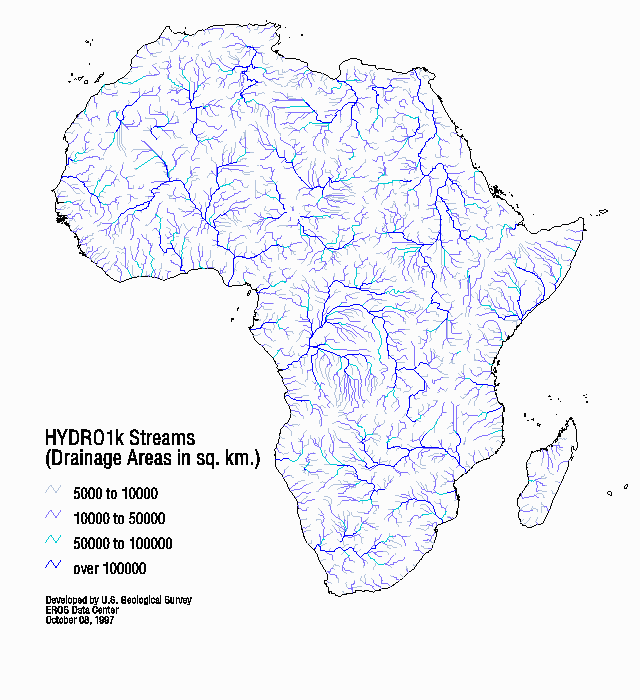 Streams