-
 GenCost: Minimal cost analysis of motion over a friction model
GenCost: Minimal cost analysis of motion over a friction model| Presentation and options | Dialog box of the application |
| Syntax |
The cumulative minimum cost search algorithm is MiraMon's own version of Dijkstra's Algorithm (Dijkstra, 1959). In this case, the friction model is a raster in which the value of each cell indicates its pass difficulty (friction). Thus, cells with high friction values offer higher pass resistance than those with lower values. The target raster specifies the cells with from which the minimal costs are calculated. In other words, each non-target cell will contain in the result the minimal cost for reaching a target cell. In turn, target cells are assigned any different NoData value. In a cost analysis where continentality is modeled, the target entities will correspond to the rasterization of the whole sea extent. The cost is defined from the product between the friction value (which cannot be negative in this application) and the distance covered with this value. Thus, a friction model that is constant and equal to 1 results in the distance of each cell to the nearest target. In this case, the GenCost application is similar to the BufDist.
Each resulting cell may be associated to a different cost value depending on the target cell it is calculated for. The final value assigned to each cell of the output file will always be calculated according to the target with the lowest cost; i.e. the nearest target. The application allows you to calculate the distance, from which the cost is derived, between two adjacent pixels by means of two different analysis models: considering the raster to be a node or a cell. In the first model, the distance between two cells is calculated from the center of a cell to the center of the adjacent cell and is the closest model to that of the reference article (Dijkstra, 1959). In the second, the distance from the opposite end of the adjacent cell to the nearest end. The difference between the two options lies in the fact that in the first model (node) the cost calculation between adjacent cells takes into account both friction values because the distance covered includes the position of both pixels and, on the other hand, in the second case (cell), the friction value of the adjacent cell is not taken into account.
In both models the blue areas are low friction and the grey areas high friction.
The application also allows you to choose between carrying out the cost calculation from the cell under consideration to the center of the target or to one of its ends (Option_target) regardless of the analysis model. The first case should be chosen when the position of the target within the pixel is considered to be central (e.g. a meteorological station) and, on the other hand, the second is more suitable when the target may be anywhere in the pixel or cover the whole of it (e.g. a wood) and you want to reach the edge.
For more information, see Dijkstra, E. W., 1959. A note on two problems in connexion with graphs, Numerische Mathematik, 1, S. 269-271.

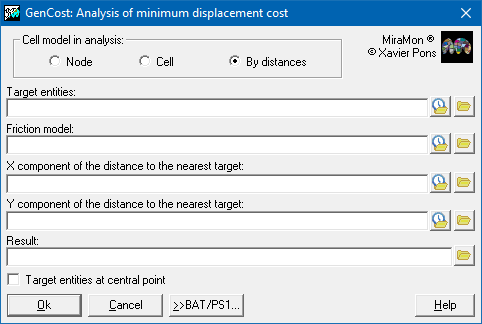 |
| GenCost dialog box |