TAPIS: Tables from APIs
TAPIS is a lightweight multipurpose tool developed in JavaScript which doesn't require installation. It's useful for:
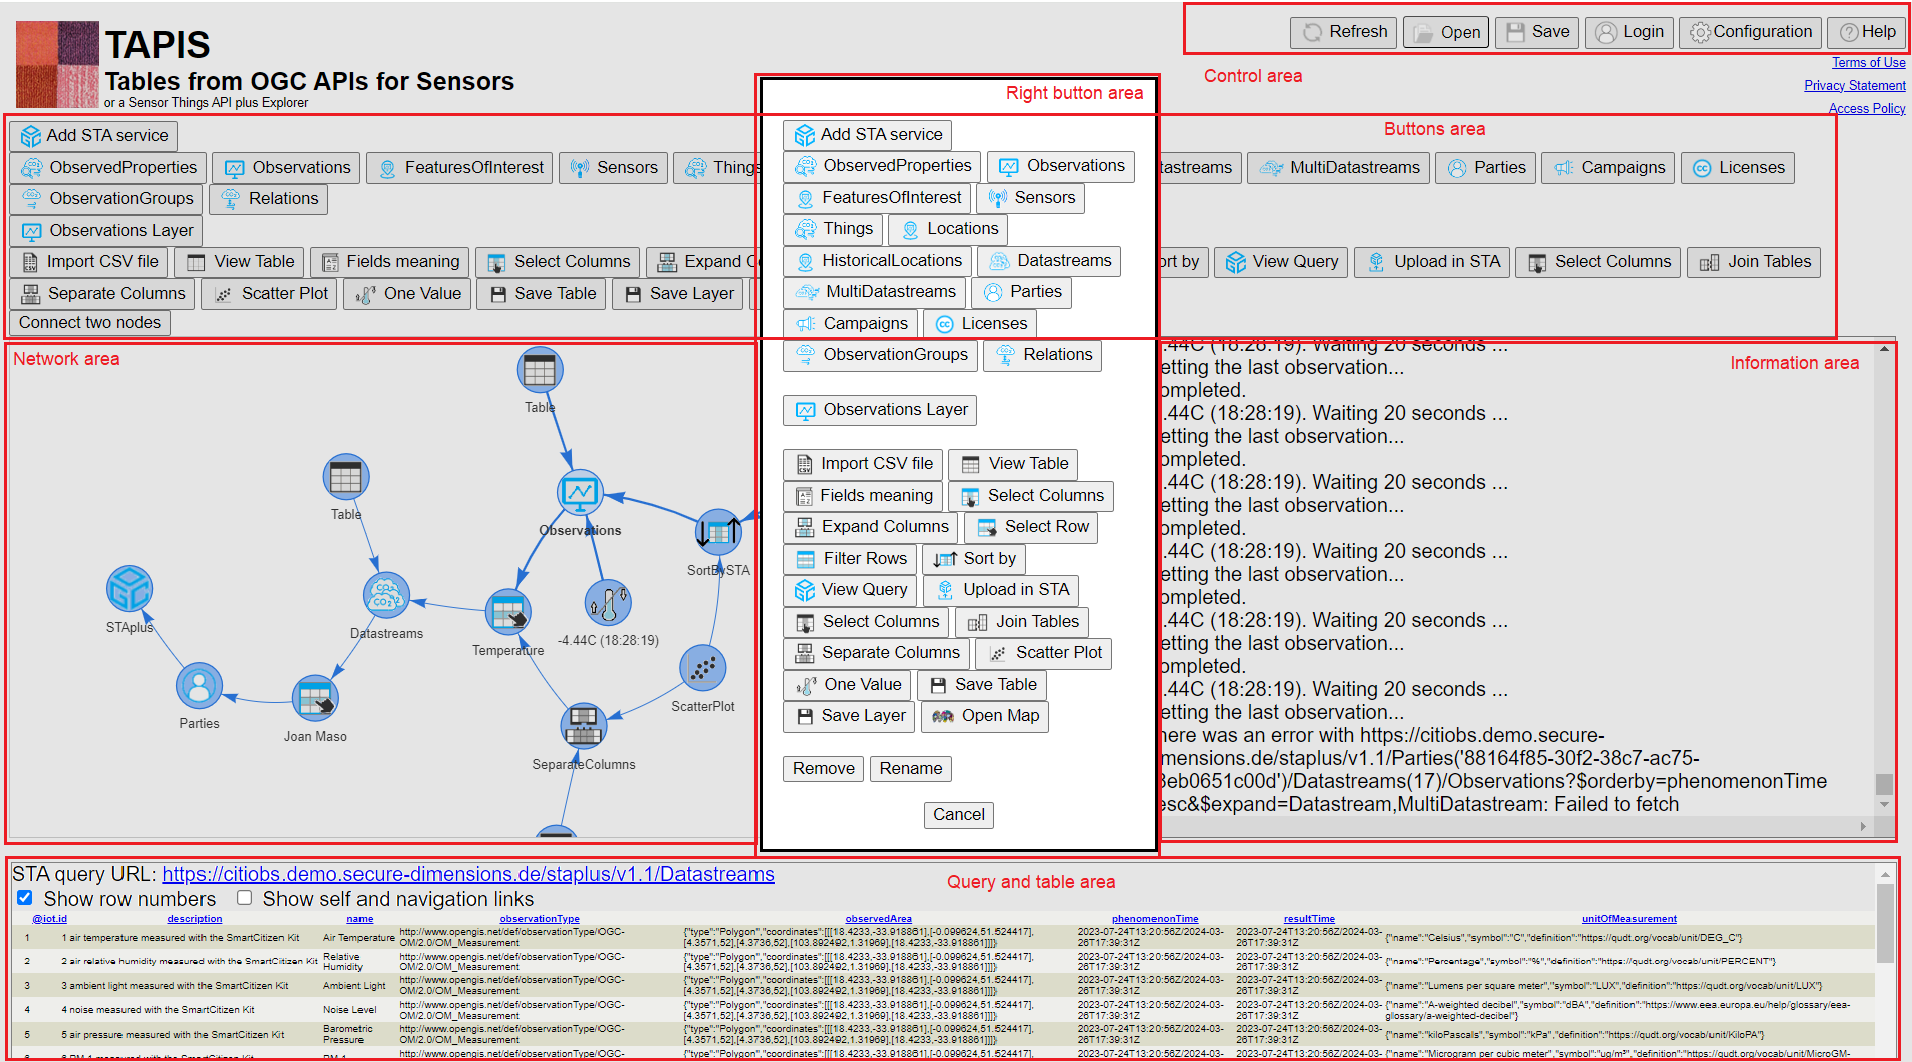
- exploring APIs and services such as SensorThings API (STA), STAplus, S3, Eclipse Data Space Connector, Catalogue Service for the Web (CSW) and OGC API collections, features, records and STAC. TAPIS is designed as a middle-ground solution between a URL based query interface such as Postman or curl and specialised domain-specific GUIs. This makes TAPIS an essential tool for conducting interoperability tests on newly developed or deployed services and API server instances.
- direct reading of CSV, DBF, GeoPackage, JSON, JSON-LD and GeoJSON file formats. TAPIS is also a table editor, capable of selecting, filtering, merging, adding grouping, sorting, pivoting and semantically enrich tabular information. A part of a classical rows and columns tabular representation, data can be presented as bar charts, pie charts, scatter plots, and maps. TAPIS is integrated with NiMMbus (the MiraMon implementation of the Geospatial User Feedback) and with the MiraMon Map Browser.
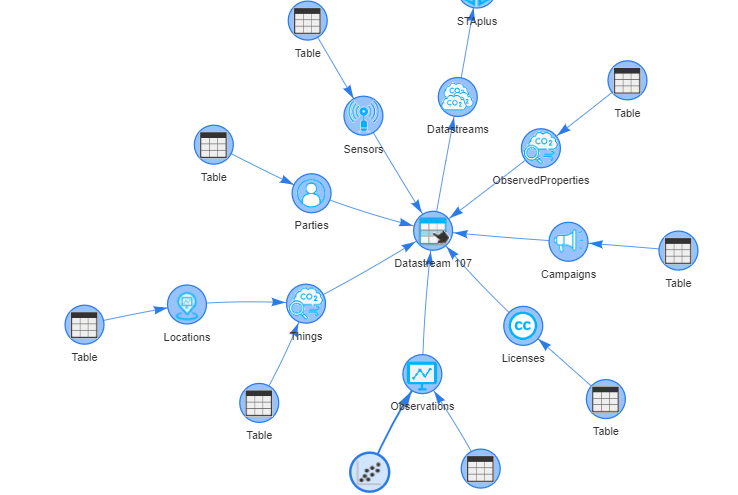
Internally, TAPIS organizes the information into structured tables (with columns that represent fields and rows that represent records), each one stored in a node-edge interface that facilitates chain operations building data workflows interactively that can be saved and reused. TAPIS is under continuous development and new functionalities to support evolving needs are being regularly implemented. TAPIS enables users to train and educate others on using SensorThings API or other supported services, APIs and file formats facilitating detailed exploration of the data without needing to build a GUI. In that respect its a platform to help people get familiar with supported services, APIs and file formats.
Access to the tool: https://www.tapis.grumets.cat
Complete information: https://www.tapis.grumets.cat/help